Published on: 2026-02-06
Updated on: 2026-04-13
Silver is trading near $74 on April 13, 2026, after a violent first-quarter reset and only a partial rebound. Silver futures settled around $73.775 on April 13, while Kitco's live spot quote showed silver near $74.19, which leaves the metal well below its 52-week high above $121 but no longer at the early-February washout levels.

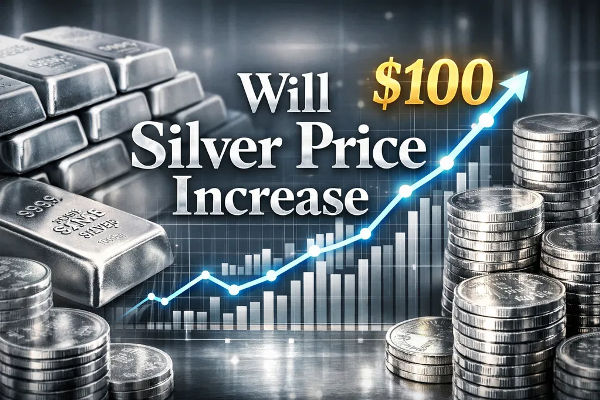
The question now is straightforward but not easy: does silver have the fuel to rebound, and can it realistically reclaim $100? The answer depends on two factors that do not always change in unison.
The first is the fundamental backdrop, where industrial demand remains structurally essential. The second is the macro and positioning backdrop, where liquidity and leverage can overpower fundamentals for weeks at a time.
| Date | Market snapshot | What it signaled |
|---|---|---|
| Jan 29, 2026 | 52-week high above $121 | Blow-off move left little technical support underneath |
| Feb 6, 2026 | Spot near $71, with intraday washout near $64 | Forced selling and liquidation dominated the tape |
| Apr 10, 2026 | Silver futures at 76.480 | Recovery attempt pushed silver back into the mid-$70s |
| Apr 13, 2026 | Spot near $74.19, silver futures at 73.775 | Market is stabilizing above the February washout, but short-term momentum is still soft |
The speed of the move is still the story, but the context has changed. Silver is no longer sitting at the early-February panic zone. Futures were 73.775 on April 13, after trading as high as 76.480 on April 10 and as low as 71.987 on April 7, which points to a market that is trying to stabilize in the mid-$70s rather than one still in freefall.
Spot silver: about $74.19/oz on April 13, 2026
Silver futures: 73.775 on April 13, 2026
52-week range (futures reference): 31.780 to 121.785
Distance from roughly $74 spot to $100: about 35%
The fall was roughly 35% from the late-January peak to early-February lows, after a run that was already unusually steep.
This is important for the $100 debate because a market that has dropped from $120 to $70 doesn't bounce back in a straight line. Typically, it needs to rebuild liquidity, fix its positioning, and establish new support levels before entering the next significant upward movement.
Regardless, a rise from roughly $74 to $100 is now about a 35% move, not the 41% move it was when this article was first published. That is still a large advance, but in silver terms it is no longer a stretch that requires a full reset from the lows. The bigger question is whether silver can rebuild above the mid-$70s first, then clear $80 and $90 without another speculative squeeze.

Silver already showed it can trade well above $100 during the late-January spike.
The harder question is whether it can reclaim $100 and hold it without needing another speculative squeeze. For that to happen, three conditions usually need to align.
It is also important to separate a stretch target from a base case: J.P. Morgan Global Research said in February that it sees silver averaging $81/oz in 2026, which supports a bullish medium-term backdrop but still suggests that a durable move back to $100 would likely need another strong momentum leg, not just steady fundamentals.
A market can rally with high volatility, but it rarely holds a new plateau while daily ranges stay extreme. Currently, the volatility backdrop remains elevated.
If the dollar stabilizes and yields stop pressuring metals, silver can start to trade its own supply story again. The recent downdraft was closely tied to macro risk rotation and dollar dynamics, suggesting the market is still trading silver like a high-beta macro asset.
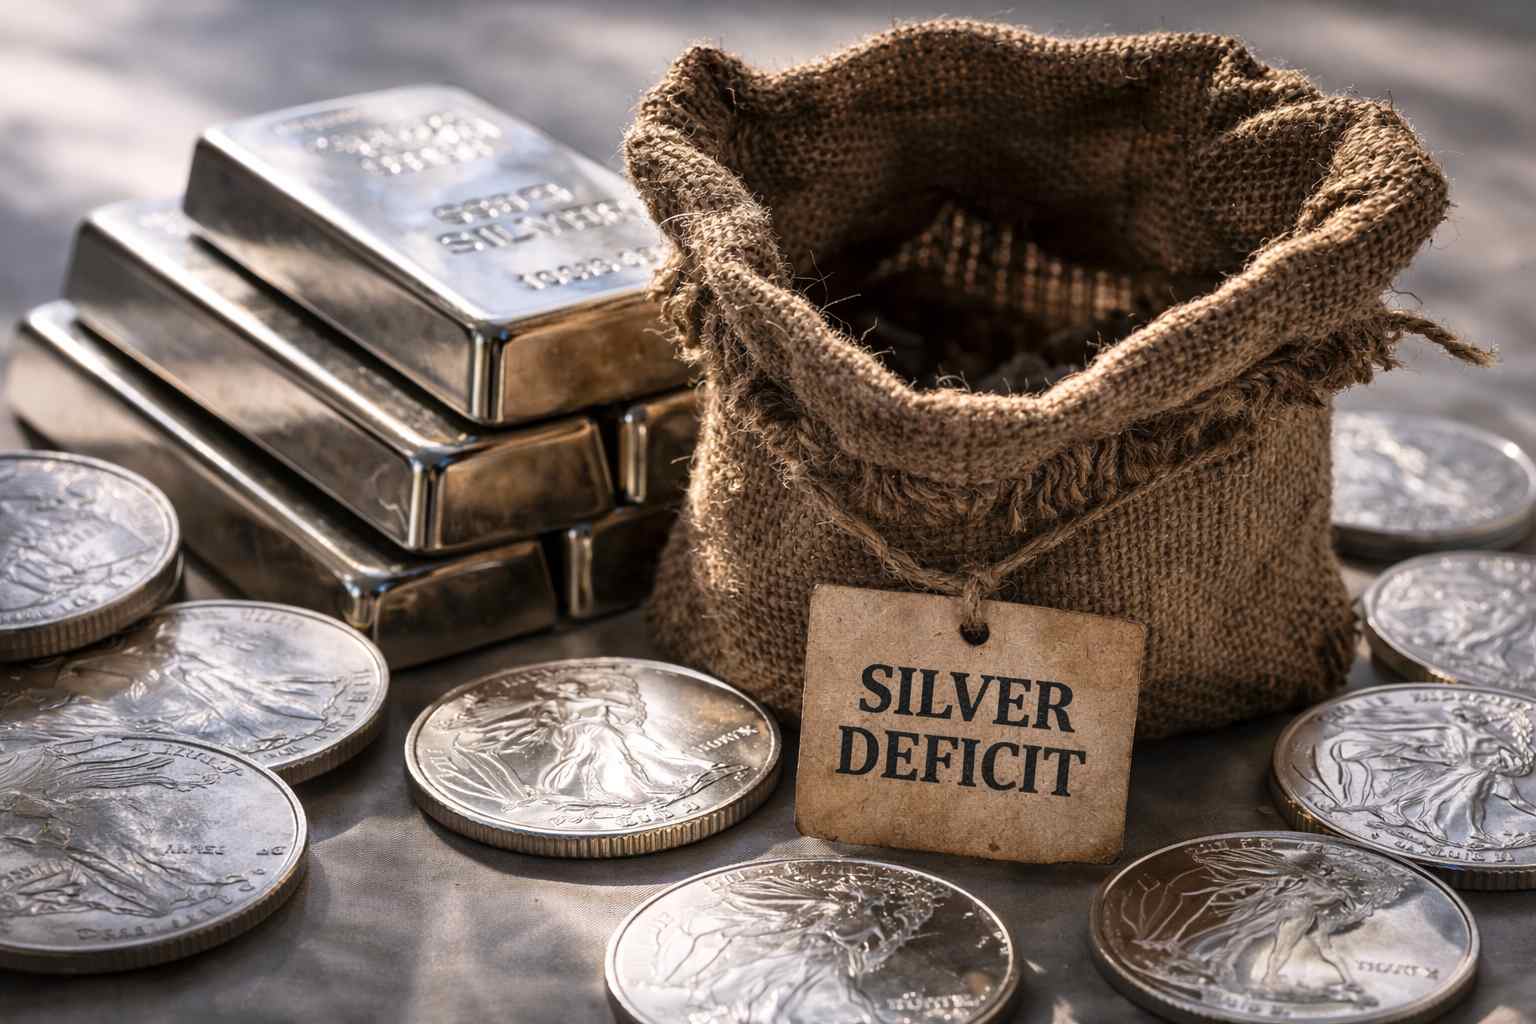
The Silver Institute data describes a multi-year deficit and record industrial demand.
Price tends to respond more durably when the tightness is visible in availability, delivery timing, or sustained investor allocation, not only in annual balance tables.
| Scenario | What it looks like | What could cause it |
|---|---|---|
| Fast rebound | Silver reclaims $76 to $80 and starts testing the mid-$80s | Softer USD, calmer rates outlook, renewed buying |
| Range trade | Silver holds roughly $72 to $76 with sharp two-way swings | Volatility cools, but no clear macro driver emerges |
| Deeper pullback | Silver slips back below $72 and retests the upper-$60s | Stronger USD, higher rates pressure, or another liquidation wave |
These scenarios are not forecasts. They are decision frameworks.
A move to $100 requires milestones. Traders often watch these round-number zones because they influence behaviour and stop levels.
$75 to $80: first recovery zone, where sellers often reappear
$90: psychological level, often tied to media coverage and momentum
$100: major headline level, where profit-taking can be aggressive
This is not a prediction; instead, it describes how markets frequently behave around significant numbers.

Silver's smaller market size makes it prone to sharp swings, and investors were reducing risk as money rotated elsewhere.
That dynamic is familiar: when margin pressure hits, silver often becomes the "sell what you can" metal before it becomes the "sell what you want" metal.
Silver's downdraft also relates to a stronger dollar impulse, which mechanically pressures metals priced in dollars and changes hedging behavior across commodities.
Even if the long-term case for metals remains intact, a short-term dollar bid can still trigger fast de-risking in futures and leveraged products.
Additionally, liquidation selling from China was part of the explanation for the late-week drop, with futures sliding as much as 13% at one point.
For example, China's export-related policy headlines and the risk of market fragmentation have contributed to extreme price behavior.
Finally, the recent surge in gold and silver was a speculative frenzy that reversed suddenly, linking the correction to a stabilizing narrative about the dollar related to the Fed leadership discussion.
When a market starts trading on headlines and leverage, it can gap in both directions even if the underlying physical story changes very little.
If you cut through the noise, the long-term case for silver often boils down to one key point: demand has consistently outpaced supply.
The Silver Institute reported:
Industrial demand: 680.5 million ounces in 2024, a record for the fourth straight year
Market deficit: 148.9 million ounces in 2024, the fourth consecutive annual deficit
Total demand: 1.16 billion ounces in 2024
Mine production: about 819.7 million ounces in 2024 (mostly flat)
Recycling: about 193.9 million ounces in 2024 (up 6%)
2026 outlook: the silver market is expected to remain in deficit for a sixth consecutive year
Investment outlook: silver investment is expected to remain strong in 2026
World Silver Survey 2026 release date: April 15, 2026
Silver is not only a "safe haven" trade. It is also an industrial metal. Demand is tied to power grids, electronics, and clean energy.
The Silver Institute noted that green economy uses contributed to demand growth, including:
Grid infrastructure
Electric vehicles and charging
Photovoltaics
End uses linked to artificial intelligence-related electronics demand
It also highlighted that China's newly added solar capacity reached 278 gigawatts in 2024, which helps explain why silver demand has stayed firm.
In short, deficits don't ensure a continuous upward trend, but they can make it harder to maintain dips if physical demand remains steady.
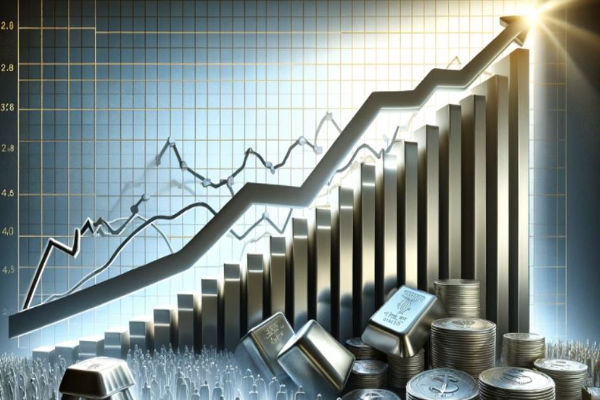
Silver can still increase soon, but the cleaner setup now is a step-by-step rebuild rather than an instant sprint back to triple digits.
The fastest route to $100 would still be renewed momentum, but the more durable path is a move from the mid-$70s into $80, then $90, while volatility cools and the physical deficit becomes more visible in flows, inventory, or sustained investor allocation.
| Indicator | Reading | What it suggests |
|---|---|---|
| RSI (14) | 30.343 | Weak momentum, close to oversold territory |
| MACD (12,26) | -0.086 | Downward momentum still present, but less extreme than the February washout |
| 200-day MA (simple) | 73.964 | Long-term trend line sits just above price |
| Classic pivot R3 | 76.644 | First stronger upside breakout zone traders may watch |
Silver's short-term technical picture is still soft after last week's pullback, but it is less extreme than the early-February washout. Investing.com's technical page currently shows an overall Strong Sell summary, while the Daily and Weekly views are Neutral, which fits a market that is trying to base rather than fully trend higher yet.
Investing's Silver futures technical page shows:
RSI (14): 30.343 (Sell)
MACD (12,26): -0.086 (Sell)
200-day simple moving average: 73.964 (Sell)
Summary signal: Strong Sell overall, with Daily and Weekly both Neutral
From the same technical snapshot, classic pivot points include:
S1: 72.619
Pivot: 73.722
R1: 74.631
R3: 76.644
Here is a practical checklist for traders to bookmark.
US dollar trend
US real yields and rate expectations
Risk sentiment across equities and credit
Changes to margin and trading conditions in futures markets
Signs of renewed Chinese trading activity
Evidence that industrial demand remains firm (solar, EV, electronics)
CME's 100-ounce silver futures contract is now live. CME announced the launch on January 13, 2026, with an effective date of February 9, 2026, and its contract overview page is now active. That matters because smaller silver contracts can widen participation and sometimes amplify short-term positioning shifts.
Silver can increase from here, but the cleaner confirmation would be a hold above the daily pivot near 73.722, followed by a recovery through resistance near 74.631 and then 76.644. As of April 13, short-term technicals still lean weak overall, so rebounds may stay sharp and uneven until price can hold above the mid-$70s with calmer volatility.
Silver fell because leverage and position unwinds hit a smaller, less liquid market quickly. Furthermore, risk rotation, dollar strength, and liquidation flows can overshadow fundamentals in the short term.
Yes, it can reclaim $100, but that should be treated as a stretch outcome, not the base case. Silver has already traded above $100 in this cycle, and J.P. Morgan's February outlook put the 2026 average at $81/oz, which means the medium-term case can stay bullish even if triple digits are not the consensus path.
Industrial demand hit a record 680.5 million ounces in 2024, and the Silver Institute reported a 148.9 million ounce deficit for 2024. Those figures suggest the market remains structurally tight over time, even if prices swing violently.
Silver no longer looks like it did on February 6, but it still does not look like a market that has fully repaired the damage from the January spike and unwind.
With spot near $74 on April 13, a return to $100 would require roughly another 35% upside from current levels. That is achievable in silver, but it likely needs calmer volatility, a friendlier dollar backdrop, and fresh demand.
Meanwhile, the structural backdrop remains supportive. The Silver Institute said in February that the silver market is expected to remain in deficit for a sixth consecutive year in 2026, with investment demand remaining strong, and World Silver Survey 2026 is scheduled for April 15. That is why the bullish case is still alive even after the pullback.
Disclaimer: This material is for general information purposes only and is not intended as (and should not be considered to be) financial, investment or other advice on which reliance should be placed. No opinion given in the material constitutes a recommendation by EBC or the author that any particular investment, security, transaction or investment strategy is suitable for any specific person.