Published on: 2025-09-12
Updated on: 2025-09-12
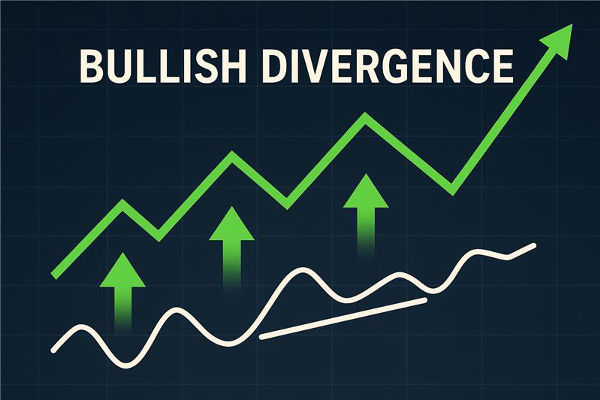
When trading, one of the most powerful tools to predict potential market reversals is bullish divergence. Simply put, bullish divergence occurs when the price of an asset lowers, but an indicator like RSI or MACD moves higher. This mismatch signals that sellers may be losing strength and buyers could soon take control, leading to a possible price rally.
For beginners, think of bullish divergence as the market whispering: "Prices are falling, but momentum says the fall is weak. Get ready for a turnaround."
In this guide, we'll break down what bullish divergence means, the different types, real-life chart examples, and how traders can use it in their strategies. By the end, you'll understand why many traders consider it one of the most reliable reversal signals.

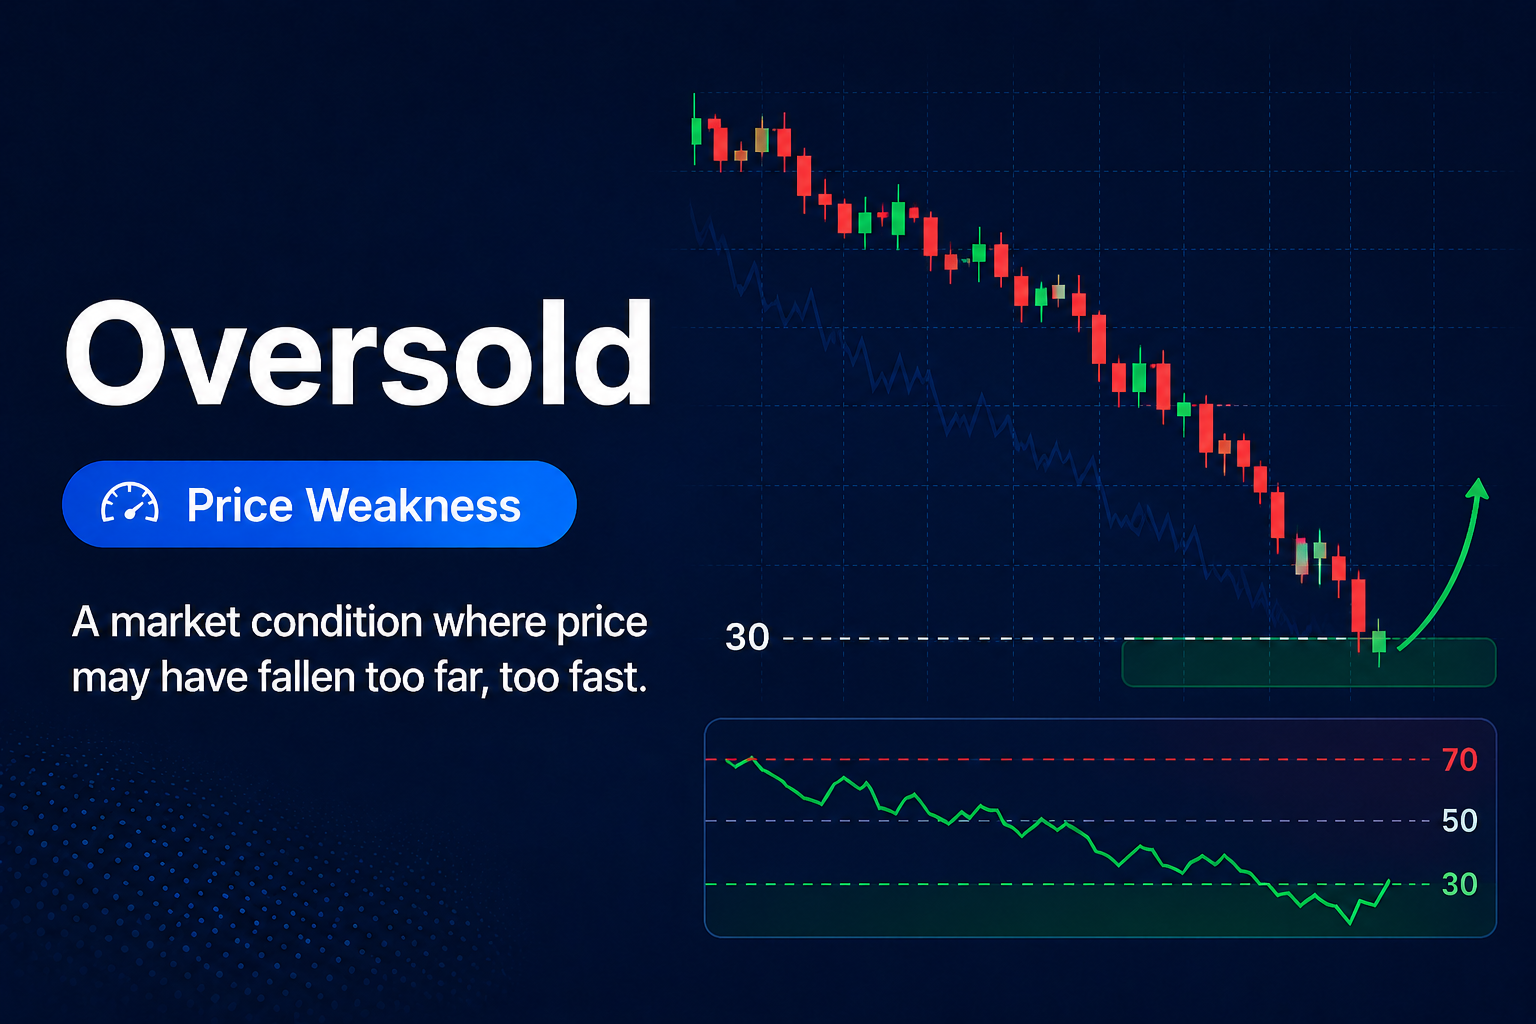
As mentioned above, bullish divergence occurs when the price makes lower lows, but the technical indicator makes higher lows.
For example:
If Bitcoin drops from $30,000 to $28,000, but the RSI moves from 35 to 45 during the same period, this is a bullish divergence.
The key idea is that the indicator disagrees with the price, and usually, the indicator is right.
Forex: Often seen in pairs like EUR/USD and GBP/USD during trend reversals.
Stocks: Common in tech stocks like Tesla, Apple, or Microsoft during pullbacks.
Crypto: Very effective in volatile coins like Bitcoin and Ethereum.
Commodities: Gold and silver often show bullish divergence before major rallies.
Early Reversal Signal: It often warns traders before the price actually turns upward.
Works Across Markets: You can use it in forex, stocks, crypto, or commodities.
Improves Risk-Reward: Catching reversals early means you can enter trades at better prices.
In short, bullish divergence is like spotting cracks in the wall before the building collapses.

1. Regular Bullish Divergence
What it is: Price makes lower lows, but the indicator makes higher lows.
What it means: A strong reversal is likely. Sellers are exhausted, and buyers may soon dominate.
Example: In forex, if EUR/USD drops to a new low, but the MACD histogram shows a higher low, it often signals an upcoming bullish rally.
Regular divergence is most effective at the end of a downtrend.
2. Hidden Bullish Divergence
What it is: Price makes higher lows, but the indicator makes lower lows.
What it means: Instead of a reversal, this signals a trend continuation. Buyers are quietly accumulating, preparing for the uptrend to continue.
Example: If gold dips a bit in an uptrend but the RSI creates a lower low while the price remains higher, it indicates a hidden bullish divergence.
Hidden divergence is useful when trading trend pullbacks.
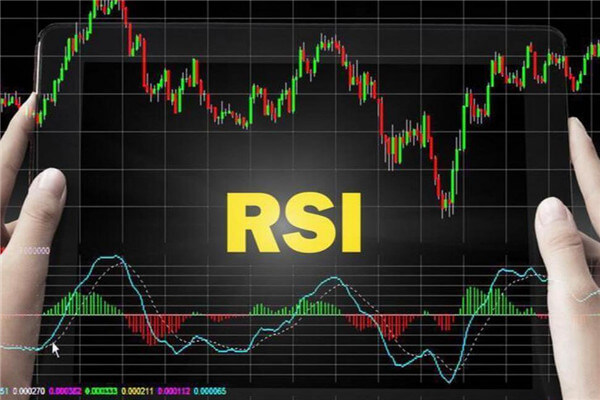
RSI measures overbought and oversold conditions.
When price falls but RSI rises, it's often a bullish divergence.
The MACD histogram or signal lines can distinctly indicate divergence.
A bullish signal is indicated by a higher low on MACD while the price reaches a lower low.
Similar to RSI, it tracks momentum.
Works well in spotting hidden bullish divergences.
Tracks buying and selling volume.
If price dips but OBV rises, it suggests accumulation.

Step 1: Identify the Trend
Look for a downtrend when searching for regular divergence. To identify hidden divergence, seek a pullback in an uptrend.
Step 2: Confirm with Indicators
Check RSI, MACD, or stochastic to confirm the divergence.
Step 3: Look for Chart Patterns
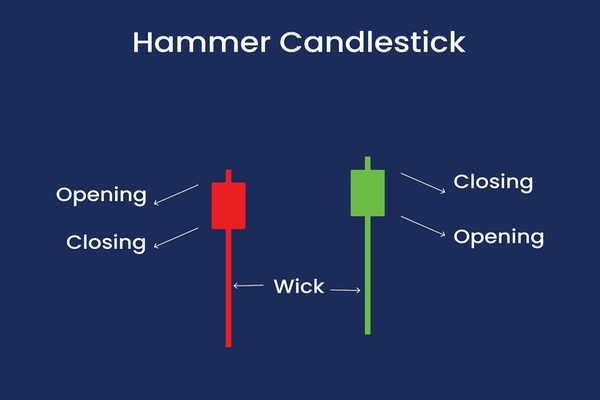
Combine divergence with support levels, double bottoms, or candlestick patterns such as hammers.
Step 4: Enter the Trade
For regular divergence: Enter long after confirmation (e.g., bullish candlestick breakout).
For hidden divergence: Enter during a pullback in the uptrend.
Step 5: Set Stop-Loss and Target
Place a stop-loss below the recent swing low.
Target recent resistance or use risk-reward ratio (1:2 or 1:3).
| Advantages | Limitations |
|---|---|
| Provides early warning of reversals | Can give false signals in strong trends |
| Works across multiple assets and markets | Requires confirmation with other indicators |
| Enhances risk-reward entry points | Not 100% accurate, must use stop-losses |
| Helps traders spot hidden accumulation | May lag in very volatile markets |
Combine divergence with support/resistance levels for stronger signals.
Use multiple indicators to confirm divergence (RSI + MACD).
Backtest divergence strategies on demo accounts before going live.
Stay updated on economic news, as major announcements can override divergence signals.
Bullish divergence happens when the price makes lower lows, but an indicator like RSI, MACD, or Stochastic makes higher lows, signalling weakening selling pressure and a potential price reversal upward.
Yes, bullish divergence is often considered a buy signal, but traders should always wait for confirmation from price action or support/resistance levels before entering a trade.
The RSI and MACD are the most widely used indicators for spotting bullish divergence.
Yes, like all technical tools, bullish divergence is not 100% accurate. It can give false signals in strong downtrends or highly volatile markets.
In conclusion, bullish divergence is one of the most powerful tools traders can use to spot potential reversals or confirm trend continuations. By comparing price action with momentum indicators, traders gain an edge in anticipating moves before they happen.
For beginners, it's a must-learn concept because it helps identify high-probability entry points with relatively low risk and will give you the confidence to spot hidden opportunities in the market.
Disclaimer: This material is for general information purposes only and is not intended as (and should not be considered to be) financial, investment or other advice on which reliance should be placed. No opinion given in the material constitutes a recommendation by EBC or the author that any particular investment, security, transaction or investment strategy is suitable for any specific person.