Published on: 2026-01-12
Updated on: 2026-01-13
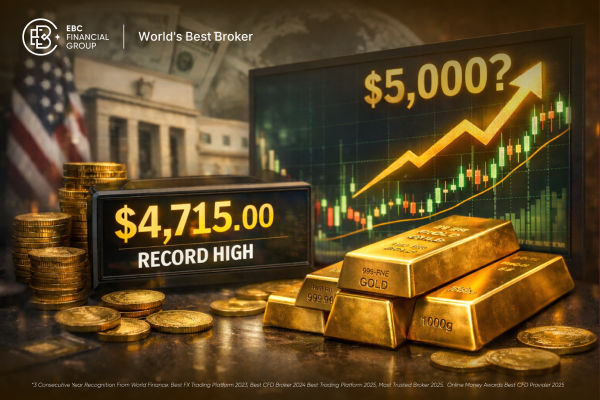
On January 13, gold remained elevated after breaking above $4,600, but price action consolidated below the peak, with XAU/USD near $4,585.87. Silver eased to around $84.2 after printing a record high near $86.2.

Moves like this do not happen on quiet days. The surge is being powered by a clear mix of fear, policy uncertainty, and positioning, with a few metal-specific factors that matter more for silver than for gold.
When gold and silver rise together at this speed, the market is usually sending a message about confidence in the outlook for rates, the US dollar, and geopolitical risk.
| Instrument | Latest shown | Day range | 52-week range | Notable record detail |
|---|---|---|---|---|
| XAU/USD | $4,585.87 | $4,578.23 to $4,607.67 | $2,656.73 to $4,630.09 | Record-high area sits near $4,630.09. |
| XAG/USD | $84.2 | $83.43 to $85.41 | $28.16 to $86.24 | Record-high area sits near $86.24. |
Gold’s latest pullback is modest relative to the size of the breakout, and the market is still holding in the upper end of its recent range.
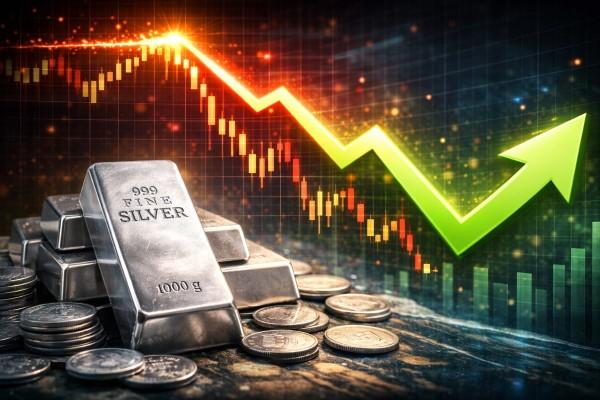
Silver is correcting more sharply, which is consistent with its higher beta and the way post-breakout profit-taking typically shows up first in the thinner, more momentum-driven leg of the metals complex.

The clearest explanation is also the oldest one. When geopolitical risks rise, investors often reallocate toward perceived safe-haven assets.
For context, the metals record highs today are tied to rising geopolitical tensions, including unrest in Iran, and a wider rise in risk aversion.
When that kind of demand shows up, it tends to lift gold first, then pull silver along behind it. Silver often moves more sharply because it is smaller, more volatile, and more sensitive to flows.
Gold and silver do not pay interest. That means they often benefit when investors expect interest rates to fall, because the "opportunity cost" of holding metals drops.
In this most recent case, the weaker-than-expected US employment data increased expectations around Federal Reserve rate cuts, which supported bullion.
Even if the Fed does not cut immediately, what matters for pricing is direction. When traders anticipate a downward shift, metals frequently adjust upward.
A softer US dollar usually supports dollar-priced commodities. Today's move also has an extra twist: the market is watching a highly unusual public conflict around the Federal Reserve.
For context, the dollar index fell approximately 0.3% to around 98.899, after news tied to a criminal investigation involving Fed Chair Jerome Powell, and gold jumped to a record in the same window.
For gold, this matters because it is not only about rates. It is also about trust. When investors worry that policy could become less predictable, they often want a hedge that does not depend on any single government's promise.
One reason gold can trend for longer than many traders expect is that central bank demand can be steady and price-insensitive.
According to the World Gold Council, central banks purchased a net of 45 tonnes in November, bringing the total reported buying for the year through November to 297 tonnes.
That kind of underlying demand does not explain every intraday spike, but it can help explain why pullbacks have been shallow during strong cycles.
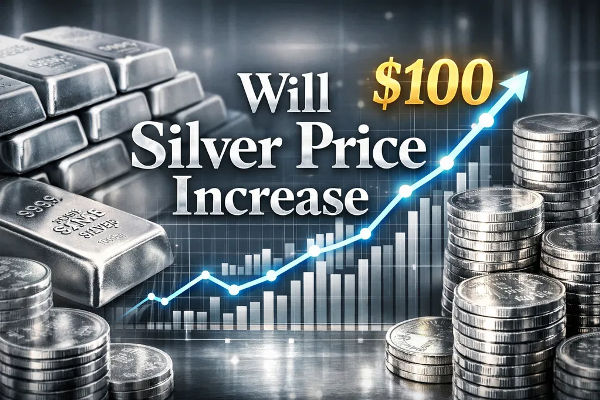
Silver is part precious metal and part industrial metal. That mix can create explosive moves when investors pile in.
The Silver Institute stated the silver market was on course for a fifth consecutive structural deficit in 2025, with the deficit estimated at 95 million ounces.
They also highlighted a multi-year cumulative deficit of nearly 820 million ounces from 2021 to 2025, which helps explain why the silver market remains tight.
The same update also noted great changes in silver-backed product holdings during 2025, which is consistent with the idea that investment flows can quickly overwhelm available supply.
Gold and silver at record highs do not automatically mean they must fall next. It does mean risk is higher, because expectations are now elevated and positioning can get crowded.
Here are the two practical takeaways to focus on:
When metals reach new highs, volatility often rises. That is especially true for silver.
If inflation data surprises or if geopolitical risk cools, the market can reprice quickly. Reuters noted that markets are also focused on upcoming US inflation data, which can shape rate expectations.
| Indicator | Gold (XAU/USD) | Silver (XAG/USD) |
|---|---|---|
| Technical summary (Daily) | Strong Buy | Strong Buy |
| RSI (14) | 55.412 | 52.093 |
| MACD (12,26) | 19.19 | 0.963 |
| MA(20) Simple | $4,597.46 | $84.7876 |
| MA(50) Simple | $4,536.36 | $81.3576 |
| MA(200) Simple | $4,440.55 | $77.3357 |
| Classic Pivot (P) | $4,595.04 | $84.1378 |
| Classic Support 1 (S1) | $4,582.41 | $83.8401 |
| Classic Resistance 1 (R1) | $4,611.85 | $84.4171 |
| 52-week high area | $4,630.09 | $86.2385 |
Daily directional signals still lean constructive, but the post-spike profile has shifted from pure momentum into consolidation. Both metals are now oscillating around their pivot zones, and the key tell is whether price can sustain acceptance back above the 20-day average after the initial breakout impulse cooled.
Gold (XAU/USD):
Pivot magnet: $4,595, a key intraday decision level in the current consolidation.
First support: $4,582, where a clean break increases the odds of a deeper retracement toward the mid-$4,560s.
Overhead resistance: $4,612 to $4,624, followed by the record-high area near $4,630.
Trend integrity zone: the 50-day near $4,536, with the 200-day near $4,441 as the deeper trend anchor.
Silver (XAG/USD):
Pivot magnet: $84.14, the level that price often re-tests while momentum digests the breakout.
First support: $83.84, with additional supports layered below into the low-$83s if selling pressure persists.
Overhead resistance: $84.42 to $84.99, while the broader “record-high area” remains near $86.24.
Swing support: the 50-day near $81.36, then the 200-day near $77.34 if the pullback extends.

As mentioned above, a mix of macro data and headlines will likely shape the next move. Traders should pay attention to these items because they can change rate expectations quickly.
US inflation data
Any escalation or de-escalation in geopolitical stress
Central bank activity
For silver, watch indicators of tightness such as demand for silver-backed products and any fresh signals about supply deficits.
Both metals reached record highs due to stronger safe-haven demand, increased bets on US rate cuts after weaker jobs data, and a softer US dollar tied to rising policy uncertainty.
Silver often moves more sharply because it is more volatile and can be affected by physical market tightness and inventory location issues.
Daily indicators suggest extended momentum, particularly in silver, where RSI exceeds 76 and is marked as overbought. Gold's RSI is near 70, which also signals strong momentum that can cool quickly.
In conclusion, gold breaking above $4,600 and silver printing fresh records is not a random event. It is a clear message that markets are pricing in more uncertainty, and they are also leaning toward easier US policy over the year ahead.
The near-term risk is that these moves have been fast, which can lead to sharp pullbacks even inside a bullish trend.
The bigger picture is that as long as safe-haven demand remains firm and the rate path remains supportive, traders will continue to view gold and silver as front-line macro assets.
Disclaimer: This material is for general information purposes only and is not intended as (and should not be considered to be) financial, investment or other advice on which reliance should be placed. No opinion given in the material constitutes a recommendation by EBC or the author that any particular investment, security, transaction or investment strategy is suitable for any specific person.