Oracle’s recent share price decline has become a focal point for global investors. After a powerful rally supported by enthusiasm around its AI and cloud strategy, the stock has given back a significant portion of those gains as the market reassesses earnings, spending plans and valuation.
This move has raised important questions about what is driving the weakness in ORCL and what the latest technical signals are saying about the trend.
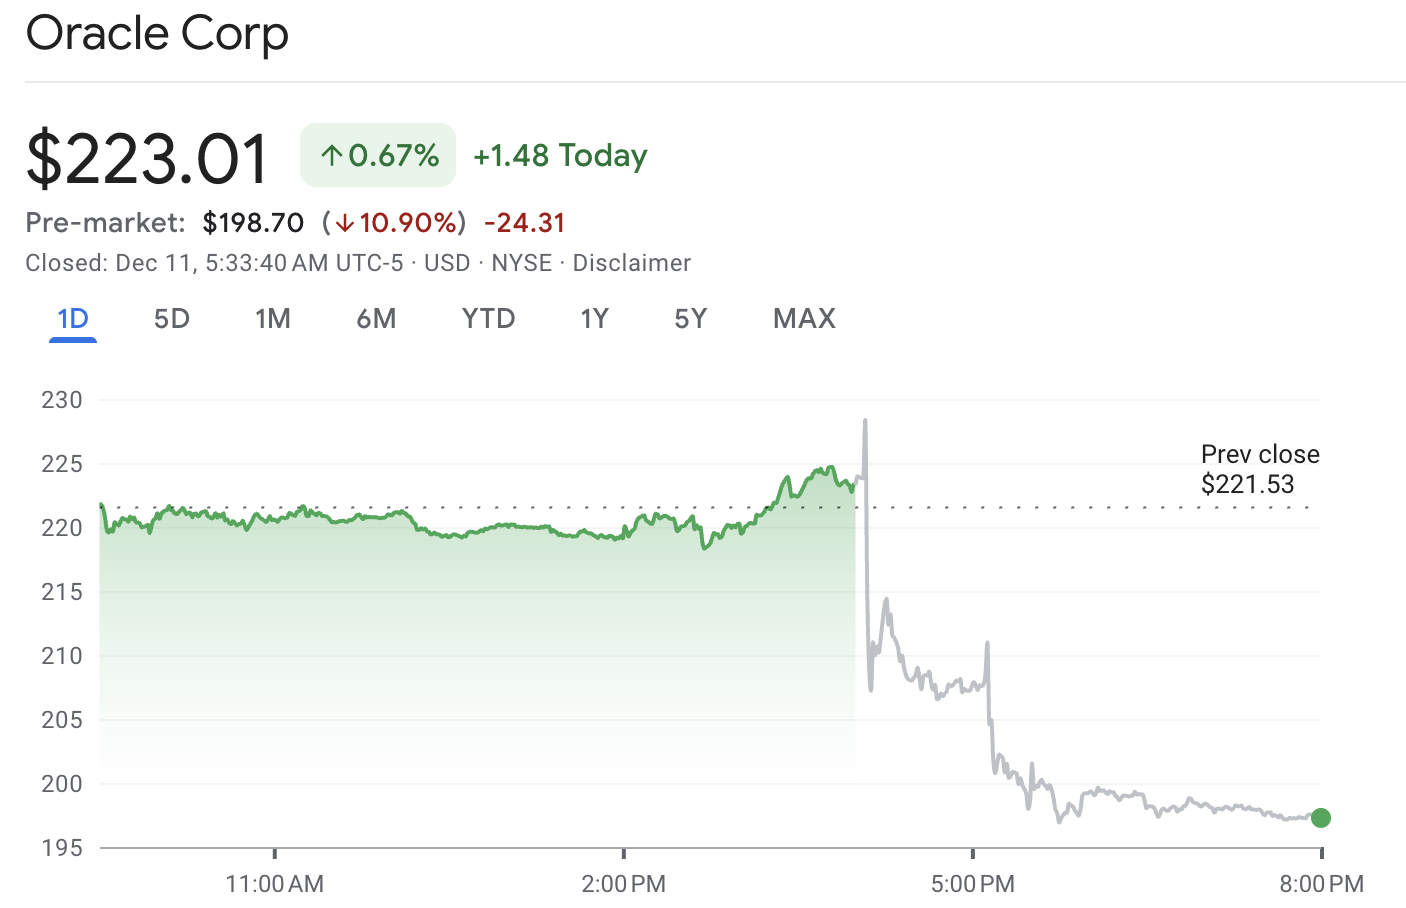
As of 10 December 2025, Oracle (ORCL) closed around $223 a share, roughly 35% below its September peak. In after-hours and pre-market trading following its latest earnings release, the stock dropped another ~11%, leaving it oscillating in the high-$190s to low-$200s.
Yet the business is still growing double-digit, cloud and AI revenue is surging, and its backlog has ballooned to over $523 billion. So why is Oracle stock falling this hard, and what are the charts telling traders right now?
Why is Oracle Stock Dropping?
In simple terms, Oracle has run into a classic “expectations vs reality” problem, amplified by big AI spending, rising debt, high valuation and a sharp technical breakdown.
The current slide in ORCL is mainly driven by:
Fresh Earnings: What Actually Just Happened?
For the quarter ended 30 November 2025, Oracle reported (fiscal Q2 2026):
Total revenue: $16.1 billion, up 14% year-on-year, but a touch below consensus.
Cloud revenue (IaaS + SaaS): $8.0 billion, up 34%.
Cloud infrastructure (OCI / IaaS): $4.1 billion, up 68%, but slightly short of very bullish expectations.
Remaining Performance Obligations (RPO): $523 billion, up 438% year-on-year after major commitments from OpenAI, Meta, Nvidia and others.
Non-GAAP EPS: $2.26, up 54%, boosted by a one-off $2.7 billion gain from selling its stake in chipmaker Ampere.
On the surface, those numbers look powerful. But the market fixated on three things:
Revenue miss vs high expectations
Guidance that didn’t fully back up the AI hype
Margins and cash flow under strain
When a stock is priced for perfection, "good but not spectacular" isn't good enough.
How Has Oracle Stock Performed?
Last Week
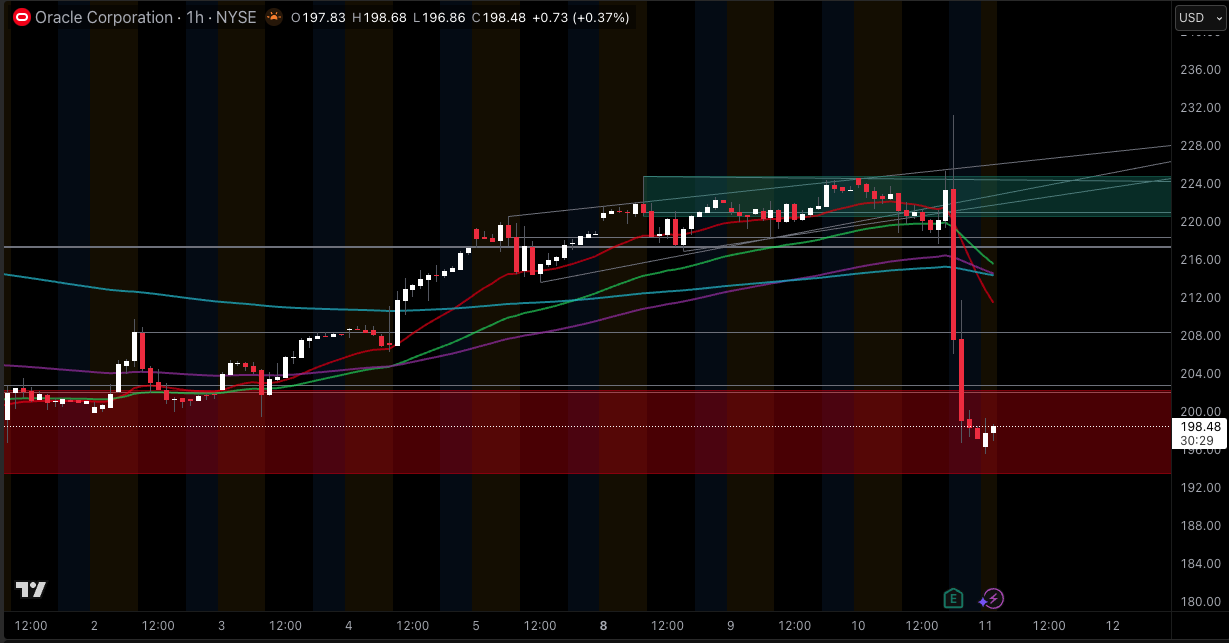
As of the 10 December 2025 close, Oracle finished around $223 per share. A week earlier, on 3 December, it closed just under $208. That means ORCL has climbed roughly 7% over the past five trading days, bouncing from the post-earnings washout and grinding back up towards its 200-day moving average.
The move is more of a reflex recovery than a full trend change: volume has stayed elevated after earnings, and the stock is still miles below its early-September AI peak near $345.
Last Month
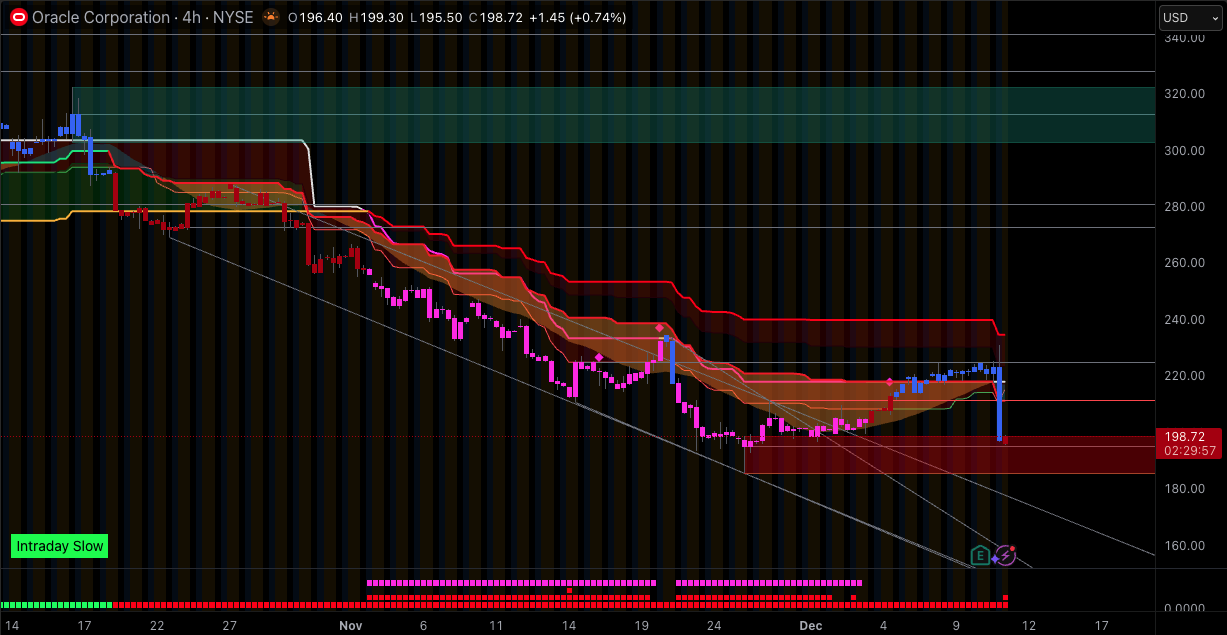
Over the last full calendar month, Oracle’s path has been rough, then slightly better:
In November alone, ORCL dropped about 23%, wiping out most of the gains that followed its huge September OpenAI-driven rally.
On a rolling 1-month basis to 10 December, performance sits around -7%, with the November slide only partially offset by an early-December bounce.
The story here is simple: November was a brutal reset as investors questioned AI capex and debt, and December so far has been more about the stock stopping the bleeding than breaking into a fresh uptrend.
Last 12 months
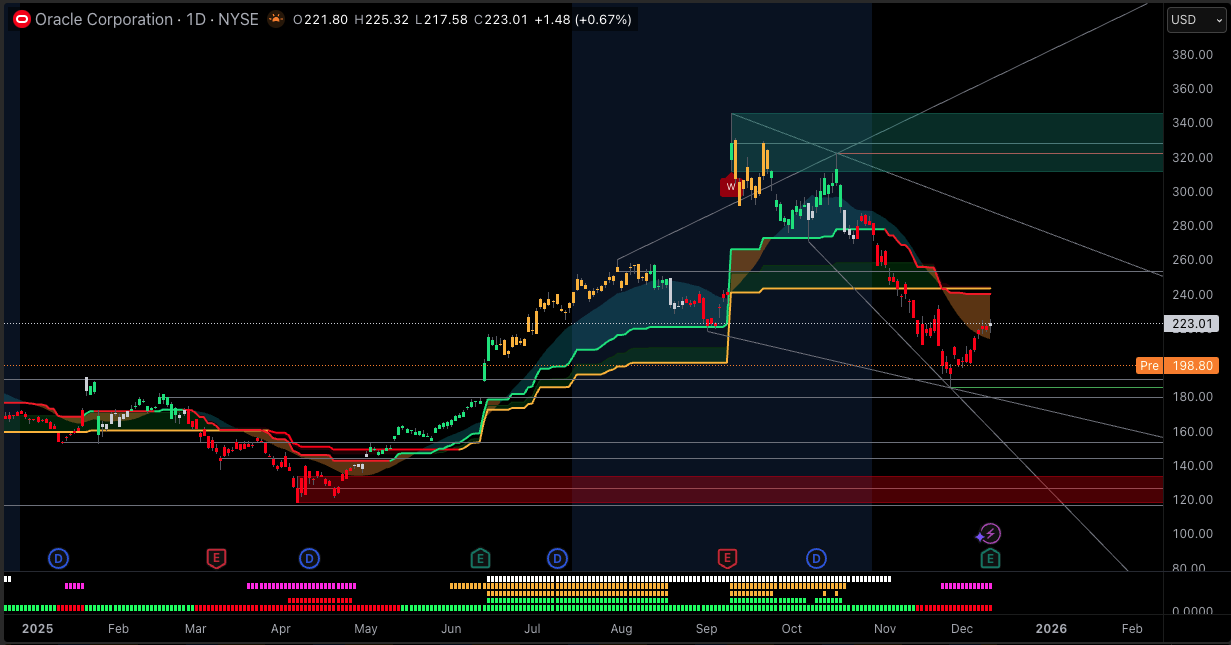
Even after the correction, Oracle is still up strongly versus a year ago:
Total return over the past 12 months (price + dividends) is roughly +27%.
Year-to-date, the stock is ahead by about 35%, even after giving back a big chunk of its AI euphoria gains.
Back on 10 September 2025, ORCL surged about 36% in a single session after announcing a massive OpenAI cloud deal, briefly pushing its market value close to the $900+ billion mark and flirting with a near-$1 trillion narrative before the reversal.
So, over a one-year window, the stock still looks like a big winner on paper, but anyone who bought into the late-summer AI spike has sat through a deep 30–40% drawdown as expectations, capex and debt have all been repriced.
So, the recent fall in ORCL is less about a collapsing business and more about a hot AI trade cooling off. The company is still growing and signing huge cloud deals, but the stock has shifted from "AI dream pricing" to something closer to a reality check on cash flow, leverage and execution.
Fundamental Reasons Behind the Oracle Stock Drop
1. Earnings miss and margin pressure vs sky-high expectations
Oracle’s latest quarter showed:
On paper, that is a solid quarter. But it was not enough for a stock priced at over 50 times trailing earnings and roughly 30+ times forward earnings, even after the pullback.
Markets are focused on:
A Fortune piece notes that the stock fell as much as 8% in a single session after Oracle presented a long-range AI outlook that investors feared may be hard to fulfil profitably.
In short: Oracle is still growing, but the bar set by AI hype was extremely high.
2. AI capex, rising debt and worries about “hidden” costs
Oracle is spending aggressively to build AI data centers packed with Nvidia chips and its own cloud infrastructure.
Recent analysis shows:
Investors now worry about:
This is happening against a backdrop where AI spending itself is under scrutiny. An Investing.com market note describes a “mini AI bear market” within the broader indices as traders question the pace and funding of AI capex.
3. High-profile critics and transparency questions
This is where the “big faces blaming Oracle” narrative comes in, and it is important to separate opinion from fact.
a) AI backlog and “real demand”
MoneyWeek quotes D.A. Davidson analyst Gil Luria, who told CNBC Oracle was engaging in “bad behaviour in the AI buildout” and that part of its reported AI order backlog may not represent firm, realistic demand.
His concern is that some of the multi-hundred-billion-dollar OpenAI commitments are flexible usage frameworks rather than guaranteed purchases, which could make the backlog look stronger than it truly is.
This does not mean Oracle is committing fraud. It does mean some analysts think the way backlog is framed is too optimistic, and those headlines alone can hurt sentiment.
b) Michael Burry and AI accounting
“Big Short” investor Michael Burry has gone further. In recent comments covered by MarketWatch and other outlets, he argues that big AI players including Oracle and Meta use depreciation schedules of 5–6 years for AI computing and networking equipment that might realistically become obsolete in 2–3 years.
According to Burry, that:
Overstates earnings by understating depreciation.
Could lead to about $176 billion in overstated profits from 2026–2028 across large tech companies.
Might mean Oracle’s earnings are overstated by around 27%, in his estimate.
He has used strong language, calling this a modern form of financial fraud. That is his view, not a legal finding. So far:
Still, when someone with Burry’s reputation says a company’s accounting “hides the brutal truth,” many short-term traders listen, and that can add selling pressure.
4. Leadership change and insider selling
In September 2025 Oracle announced that long-time CEO Safra Catz would move to Executive Vice Chair, and insiders Clay Magouyrk and Mike Sicilia would become co-CEOs.
Shortly after his promotion, Magouyrk sold around 40,000 shares, according to coverage in The Economic Times. That kind of sale after a big AI rally can be interpreted as simple diversification, but some investors read it as a lack of confidence in near-term upside.
The combination of a new leadership structure, heavy compensation in stock options, and insider selling at high levels feeds the idea that Oracle itself sees the stock as rich.
5. Sector rotation and AI bubble worries
Oracle is not alone. MoneyWeek notes that eight of the biggest AI-related stocks, including Nvidia, Meta, Palantir and Oracle, lost about $800 billion in market value in one week in early November as investors questioned high valuations and debt-funded AI spending.
At the index level, AI infrastructure names have become a crowded trade. When sentiment flips, funds rotate out aggressively into other sectors like healthcare, materials or consumer stocks.
So part of Oracle’s slide is simply the cost of being one of the poster children for the AI capex boom.
Technical view: what the ORCL chart is saying
Daily technicals for ORCL as of 10 December 2025 (21:00 GMT), using Investing.com data:
| Indicator |
Latest Value |
Signal |
What It Tells Us (Daily) |
| Price (close) |
$223.01 |
– |
Rebounded from sub-$200 post-selloff but still well below Sept high. |
| 52-week range |
$118.86 – $345.72 |
– |
Volatile year; current price sits mid-range, ~35% below peak. |
| RSI (14) |
65.38 |
Buy |
Momentum has flipped from oversold to bullish; edging towards overbought. |
| MACD (12,26) |
+2.22 |
Buy |
MACD above signal line; confirms short-term bullish momentum. |
| ADX (14) |
29.54 |
Buy |
Trend strength building; not a messy sideways market. |
| Williams %R (14) |
-23.99 |
Buy |
Price trading in upper part of recent range – buyers in control. |
| CCI (14) |
231.4 |
Overbought |
Strong upside push; near-term pullbacks very possible. |
| ATR (14) |
2.34 |
Lower vol |
Volatility has calmed versus the panic phase in November. |
| MA 20 (simple) |
$220.38 |
Buy |
Price has reclaimed the short-term trendline. |
| MA 50 (simple) |
$213.74 |
Buy |
Medium-term trend now turning back up. |
| MA 100 (simple) |
$209.10 |
Buy |
Price clearly above the intermediate trendline. |
| MA 200 (simple) |
$223.50 |
Sell |
Price is hovering just under the 200-day; key battleground. |
Overall daily rating: Strong Buy with 8/9 oscillators on Buy, 10/12 moving average signals on Buy, with the 200-day still acting as a cap.
Support and resistance zones
Using current price, recent lows and daily pivot points:
| Zone / Level |
Type |
Why It Matters |
| $213–215 |
First major support
|
Around the 50-day MA and recent consolidation zone; bulls will want this to hold on any pullback. |
| $205–210 |
Secondary support |
Near the 100-day MA; a logical level for dip buyers if 213 breaks. |
| $195–200 |
Psychological + prior low area |
Band where the latest earnings-driven selloff initially found support. A clean break below would re-open the downside. |
| $223–225 |
First resistance
|
Cluster around the 200-day MA and current closing level; acting as a ceiling for now. |
| $240–245 |
Next resistance |
Rough zone of a prior breakdown in November; a push through here would suggest the worst is behind us. |
| $280+ |
Major resistance |
Former support before the sharp October–November unwind; regaining this area would put a retest of the highs back on the table. |
From our technical analysts perspective, ORCL is:
In a confirmed daily downtrend.
Oversold to near-oversold, but not yet showing a strong bullish reversal signal on the daily timeframe.
Trading below all key moving averages, which often keeps short-term trend followers on the short side or flat.
What bulls and bears are watching now
Bulls want to see:
Bears are focused on:
How traders might approach Oracle stock now
We see three broad ways traders tend to think about a move like this:
Short-term swing trading:
Trend-following / momentum:
Long-term positioning:
Less focused on whether they buy at $215 or $225, and more on:
Can Oracle convert RPO to sustainable free cash flow?
Does management temper capex or find new funding channels (JV structures, leases) that stabilise the balance sheet?
How does regulation treat AI spending and accounting over the next 2–3 years?
If you trade ORCL or other shares via EBC, remember that CFDs and leveraged products carry a high risk of rapid loss. Always size positions and stops to reflect how volatile the stock is right now.
Frequently Asked Questions (FAQ)
1. Why is Oracle stock falling today?
Because the latest results combined a small revenue miss, huge jumps in AI capex, rising debt and guidance that didn’t fully match the AI hype.
2. Did the latest earnings cause Oracle’s stock crash?
Yes, they helped trigger it. Revenue and guidance fell a bit short of high AI-driven expectations, and worries about heavy AI capex and debt amplified the selloff.
3. Are the claims that Oracle is “hiding facts” true?
They’re unproven. Analysts have criticised Oracle’s AI backlog and hardware accounting, but no fraud findings or regulatory actions exist. The criticism mainly affects sentiment.
4. Is Oracle stock oversold now?
Because the latest results combined a small revenue miss, huge jumps in AI capex, rising debt and guidance that didn’t fully match the AI hype.
Final thoughts
Oracle is dealing with a painful but classic reset: big AI promises, heavy capex and a rich valuation collided with more modest near-term numbers, rising debt and very public scepticism from some well-known voices.
The core business remains profitable, the AI cloud pipeline is real, and management is clearly all-in on this strategy. At the same time, the market is now demanding proof in cash flow and margins, not just announcements and huge backlog figures.
For traders and investors, the message is clear: respect both the fundamentals and the technicals. ORCL’s story is far from over, but the easy AI-hype phase is behind it. From here, every quarter and every chart level will matter.
Disclaimer: This material is for general information purposes only and is not intended as (and should not be considered to be) financial, investment or other advice on which reliance should be placed. No opinion given in the material constitutes a recommendation by EBC or the author that any particular investment, security, transaction or investment strategy is suitable for any specific person.


