In a market crowded with niche and sector-specific funds, broad-based ETFs like the iShares Core S&P Total U.S. stock market ETF (ITOT) offer a compelling path for investors seeking diversified equity exposure.
As of 2025, ITOT has grown to $45 billion in assets under management, reflecting its appeal as a "one-ticket" solution to participate in the entire U.S. stock market.
But what exactly does ITOT include, and why should it be on an investor's radar this year? This article will offer insights into why you should consider this ETF through our ETD CFD platform.
Understanding ITOT ETF
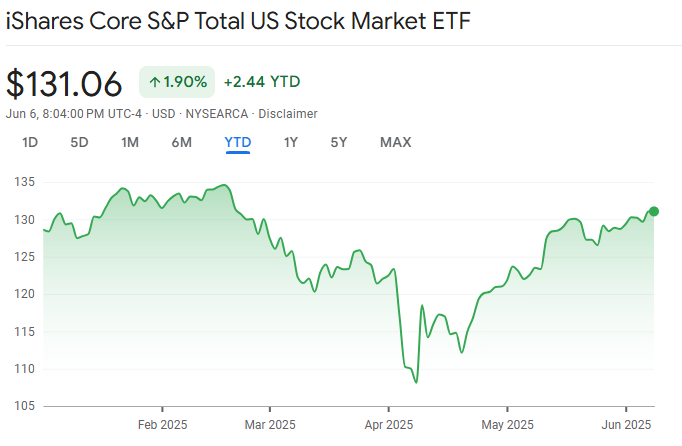
Launched in 2004, ITOT tracks the performance of the S&P Total Market Index. This index seeks to represent the breadth of the U.S. stock market, spanning large-cap, mid-cap, small-cap, and micro-cap stocks. With over 4,000 holdings, ITOT ensures exposure to nearly every corner of American publicly traded equities.
In 2025, ITOT boasts an expense ratio of just 0.03%, one of the lowest in the industry. Coupled with daily trading through major brokerages, it's become a preferred vehicle for achieving comprehensive stock market exposure with minimal costs and complexity.
How ITOT Fits in Portfolio Strategy
For investors building a balanced portfolio, ITOT can serve as the core component of equities. Its broad track record demonstrates consistent alignment with the overall U.S. equity market performance. Unlike sector-specific ETFs, ITOT minimises single-industry risk while maximising diversification.
Within a "core-and-satellite" asset allocation approach, ITOT is often the centrepiece. Investors may augment it with satellite positions, such as international ETFs, bond funds, or thematic plays, but keep ITOT as the foundation of their equities allocation, offering stability, low cost, and ease of rebalancing.
Historical Performance Overview of ITOT (2004–2025)
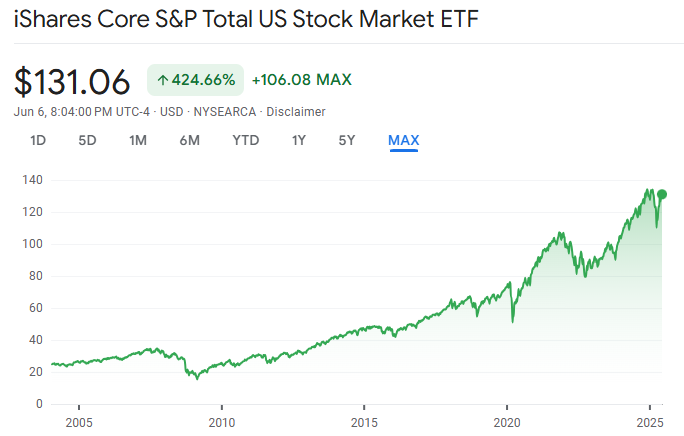
1. Inception and Early Years (2004–2010)
Launch Date: January 20, 2004
ITOT provided low-cost, broad-based exposure to the U.S. stock market.
From 2004 to 2007, ITOT delivered solid returns as the U.S. market expanded.
2008 Financial Crisis: ITOT fell sharply, reflecting the crash of U.S. equities. The fund dropped ~37% in 2008, in line with the market.
Recovery began in 2009 with an annual return of ~28%, reflecting the rebound of the U.S. market.
2. Post-Recession Growth (2011–2019)
This decade marked one of the longest bull markets in U.S. history.
| Year |
Annual Return |
Comment |
| 2011 |
1.2% |
Market stagnation |
| 2012 |
16.2% |
Strong rally |
| 2013 |
33.2% |
Fed support boosted equities |
| 2014 |
12.5% |
Steady economic growth |
| 2015 |
0.9% |
Volatility and correction |
| 2016 |
12.4% |
Post-election rally |
| 2017 |
21.0% |
Tax reform optimism |
| 2018 |
-5.3% |
Trade war fears |
| 2019 |
30.7% |
Strong tech and Fed cuts |
During this period, ITOT outperformed many actively managed funds.
The compounded annual growth rate (CAGR) from 2010 to 2019 was around 13%.
3. Pandemic and Recovery (2020–2021)
| Year |
Annual Return |
Key Events |
| 2020 |
20.7% |
Pandemic crash and tech surge |
| 2021 |
25.2% |
Continued bull run fueled by liquidity and tech stocks |
In March 2020, ITOT dropped over 30% but rebounded quickly.
The pandemic era showcased the ETF's diversification power—large-cap tech buoyed the index.
4. Correction & Inflation Period (2022–2023)
| Year |
Annual Return |
Factors |
| 2022 |
-19.5% |
Fed rate hikes, inflation |
| 2023 |
+15.6% |
AI rally, improving inflation |
ITOT faced headwinds from the Federal Reserve's aggressive monetary tightening in 2022.
It rebounded in 2023, largely due to artificial intelligence, chipmakers and the recovering tech sector.
5. Latest Performance in 2024–2025
| Year |
YTD Return (as of May 2025)
|
Comment |
| 2024 |
12.3% |
Broad market rally; large and mid-cap performance |
| 2025 |
6.1% (YTD)
|
Tech-driven gains, moderate volatility |
As of May 2025, ITOT continues to deliver solid, diversified gains.
Major contributors in 2025 include AI, semiconductors, financial services, and industrial automation.
The inclusion of small and mid-cap firms provided additional upside in Q1–Q2 2025, especially as the economic outlook improved.
Annualised Returns (as of May 2025)
| Period |
ITOT Return |
Benchmark (S&P 500) |
| 1-Year |
15.1% |
14.8% |
| 3-Year |
8.5% |
8.7% |
| 5-Year |
11.7% |
11.5% |
| 10-Year |
12.4% |
12.2% |
| Since Inception |
~9.5% |
~9.3% |
Key Features and Metrics in 2025
1) Comprehensive Market Coverage
The S&P Total Market Index underlying ITOT includes
Around 2,500 large-cap and mid-cap names from the S&P Composite 1500
Approximately 1,600 additional small- and micro-cap stocks
This wide coverage ensures participation across industries, company size, and economic cycles.
2) Ultra-Low Costs
With an expense ratio of 0.03%, ITOT remains competitive when benchmarked against peers, including its Vanguard equivalent (VTI, 0.03%) and Schwab's SWTSX mutual fund (0.03%).
Its minimal cost appeals to both retail and institutional investors, aiming to maximise returns.
3) Tax Efficiency and Liquidity
Thanks to its ETF structure, ITOT offers high liquidity—often trading with narrow bid-ask spreads.
Furthermore, its in-kind redemption mechanism enhances tax efficiency by reducing capital gains distributions, making it particularly attractive in taxable accounts.
Reasons to Invest in ITOT Now
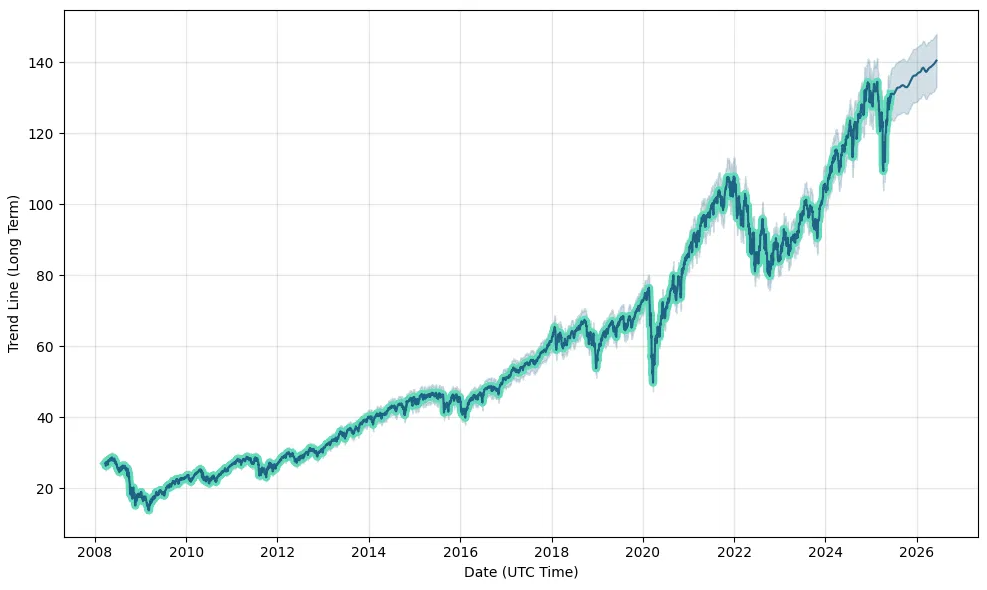
1. Simplified Diversification
By blending large, mid-, small, and micro-cap stocks across growth and value styles, ITOT effectively reduces single-stock and sector risk. It enables investors to gain full market exposure without needing a complex portfolio of individual holdings.
2. Cost and Tax Advantages
Low fees mean more return stays with the investor. Moreover, ITOT's tax structure limits distributions are crucial for those in taxable accounts trying to avoid surprise tax events.
3. Suitable for Core Allocation
ITOT embodies the idea of "owning the market." It's especially suitable for investors who want passive exposure to U.S. equities and who don't want to spend time choosing individual stocks or sectors.
"How to Use ITOT" Scenarios
1) Core-and-Satellite Approach
Combine ITOT with an international equity ETF (e.g., IXUS or VEU) and a bond fund or ETF (e.g., BND or AGG) to build a balanced portfolio. Use ITOT as your core U.S. equity position.
2) Retirement Accounts
It is suitable for IRAs or 401(k)s due to long-term growth and tax efficiency. Investors can rebalance annually or semi-annually by adjusting their weightings.
3) Taxable Accounts
Since capital gains from fund-level transactions are limited, the investor retains control over capital gains, making ITOT a strong tax advantage in ETFs compared to mutual funds.
Risk Factors to Monitor
Despite numerous advantages, ITOT still has risks. Small-cap exposure can result in outsized drawdowns during market storms. Additionally, global geopolitical and trade tensions may indirectly influence U.S.-oriented ETFs such as ITOT.
Tracking error remains low, but minor performance gaps can appear during volatile periods. Canadian investors should also consider U.S. tax treaties and any dividend withholding consequences.
Conclusion
In conclusion, ITOT is a strong idea at a time when convenience, cost, and choice are crucial. Its comprehensive U.S. exposure, rock-bottom expense ratio, and tax benefits make it ideal for investors of all types, from DIY beginners to seasoned advisors building portfolios.
If your objective is to acquire a substantial portion of the U.S. stock market with minimal effort and predictable results, ITOT is a standout option. However, remember to complement it with international and fixed-income ETFs to complete your diversified strategy.
Disclaimer: This material is for general information purposes only and is not intended as (and should not be considered to be) financial, investment or other advice on which reliance should be placed. No opinion given in the material constitutes a recommendation by EBC or the author that any particular investment, security, transaction or investment strategy is suitable for any specific person.
