The Directional Movement Index (DMI) is a technical analysis tool created by J. Welles Wilder to help traders identify whether a market is trending and how strong that trend is. It is widely used in trading strategies across forex, equities, indices and commodities.
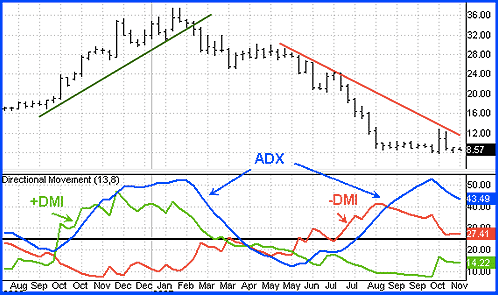
The Directional Movement Index (DMI) consists of three components: the Positive Directional Indicator (+DI), the Negative Directional Indicator (−DI), and the Average Directional Index (ADX). Together, they provide signals for both the direction and the momentum of price movement.
When used properly, the Directional Movement Index (DMI) offers clarity in market conditions that are often noisy or indecisive, making it easier for traders to determine when to enter or exit positions based on the strength of a price trend.
How the Directional Movement Index (DMI) Works
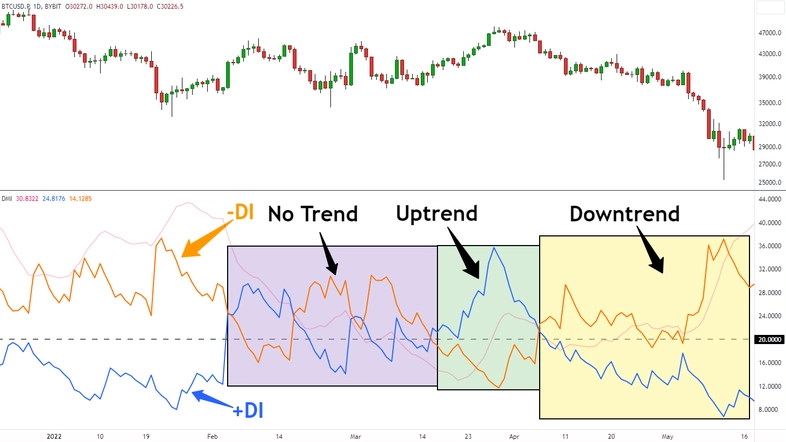
The Directional Movement Index (DMI) begins by comparing the highs and lows of price bars to determine which direction is exerting more influence—buying or selling. The +DI line reflects upward momentum, while the −DI line reflects downward momentum. These lines are plotted on a chart, and the relative position between them provides insight into market bias.
When the +DI line crosses above the −DI line, it is interpreted as a bullish signal. When the −DI line moves above the +DI line, it indicates bearish momentum. The ADX line, which is calculated from the difference between the two, shows the strength of the current trend. A rising ADX confirms the presence of a trend, regardless of its direction. If the ADX is falling, it suggests a weakening trend or the beginning of a range-bound phase.
Why Traders Use the Directional Movement Index (DMI)
Traders value the Directional Movement Index (DMI) because it can be used in various market environments. It helps them make objective decisions about whether a trend is worth trading. This is especially important in volatile or sideways markets where price action alone may not provide a clear signal.
A major advantage of the Directional Movement Index (DMI) is its versatility. It can be applied to any time frame, making it useful for intraday traders as well as long-term investors. It is particularly helpful in filtering out trades that do not meet a minimum trend strength threshold, reducing the likelihood of entering low-probability setups.
Many traders set a minimum ADX value—typically around 20 or 25—as a requirement before acting on a signal from the +DI or −DI crossover. This approach helps ensure that only meaningful trends are traded, rather than reacting to minor fluctuations in price.
Using the Directional Movement Index (DMI) in a Strategy
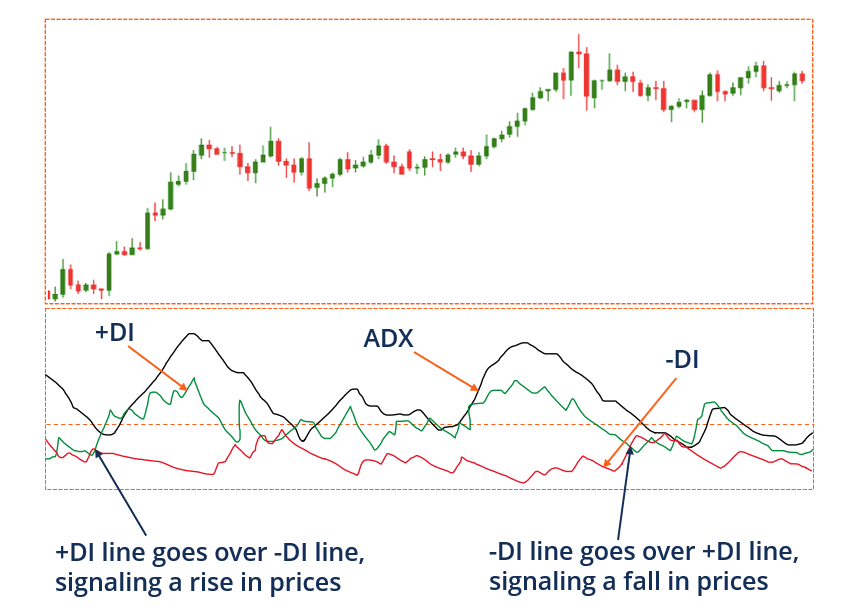
In practical terms, the Directional Movement Index (DMI) is most effective when used as part of a broader trading strategy. For example, a trader might combine the DMI with support and resistance levels to confirm a breakout. If the +DI crosses above the −DI at the same time price breaks through resistance and the ADX is rising, that could indicate a strong upward move is developing.
In contrast, if the −DI is dominant and ADX is increasing while price breaks through a support level, the trader may consider shorting the asset. The Directional Movement Index (DMI) can also be used to stay in trades. A strong and rising ADX reading often signals that the trend has room to continue, providing traders with the confidence to hold positions for longer durations.
Limitations of the Directional Movement Index (DMI)
Like all technical indicators, the Directional Movement Index (DMI) is not flawless. It is a lagging indicator, which means that signals are generated after a trend has already started. This can result in missed opportunities or late entries. In markets that are consolidating or moving sideways, the Directional Movement Index (DMI) may produce misleading crossovers that do not result in sustained moves.
The indicator also does not account for external market conditions such as economic news, geopolitical events or changes in interest rates. As a result, traders should not rely solely on the Directional Movement Index (DMI) when making decisions. Instead, it should be one tool among several in a well-rounded analysis.
Another limitation is that the ADX line only reflects the strength of a trend, not its direction. A high ADX reading does not indicate whether the trend is up or down; it simply confirms that a strong trend exists. That's why it is essential to observe the position of the +DI and −DI lines in tandem with the ADX.
Directional Movement Index (DMI) in Different Markets
The Directional Movement Index (DMI) is highly effective in trending markets like forex and commodities. In forex trading, where trends can last for days or even weeks, the DMI helps identify the strength of currency movements and potential breakout points. In commodities, it assists traders in spotting emerging trends in assets like oil, gold or agricultural futures.
Equity traders also use the Directional Movement Index (DMI) to gauge sector rotations or sustained moves in specific stocks. It is particularly valuable in trending stocks or indices where price moves are driven by macroeconomic shifts or investor sentiment.
Should You Use the Directional Movement Index (DMI)?
If your trading approach is focused on identifying and following trends, the Directional Movement Index (DMI) is a useful addition to your toolkit. It offers an objective measure of trend strength and directional bias, helping you avoid weak signals and focus on high-conviction setups. However, it should not be used in isolation. Incorporating other indicators, along with fundamental and price-based analysis, can help you make more reliable trading decisions.
The Directional Movement Index (DMI) is most effective when you already have a plan in place for trade entries, stop-losses and risk management. Used correctly, it can reinforce your trading edge and improve the consistency of your strategy.
Conclusion
The Directional Movement Index (DMI) is a versatile and practical indicator that provides clear insights into market trends and momentum. By helping traders assess both the direction and strength of a trend, it enhances decision-making and supports more disciplined trading.
When combined with other forms of analysis, the Directional Movement Index (DMI) becomes a powerful tool for navigating today's complex and fast-moving markets.
Disclaimer: This material is for general information purposes only and is not intended as (and should not be considered to be) financial, investment or other advice on which reliance should be placed. No opinion given in the material constitutes a recommendation by EBC or the author that any particular investment, security, transaction or investment strategy is suitable for any specific person.
