Published on: 2025-06-09
Updated on: 2025-06-09
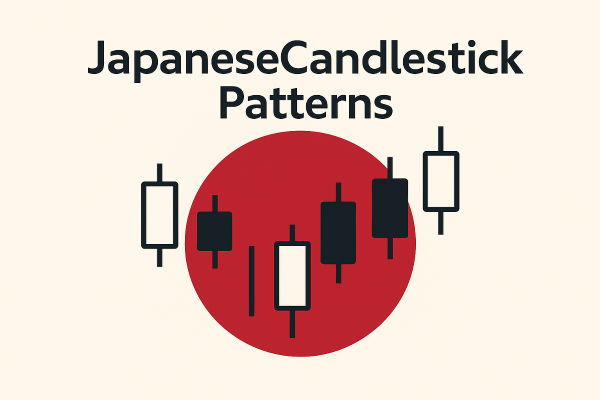
In technical analysis, candlestick patterns are among the most widely used tools by traders to predict future market movements. One of the most significant and potentially revealing patterns is the Doji candlestick. Understanding the Doji, its meaning, types, and trading implications can be a game-changer, especially in volatile markets.
In this comprehensive guide, we'll explore everything you need to know about the Doji candlestick pattern, including its types, significance, and how to trade it effectively.

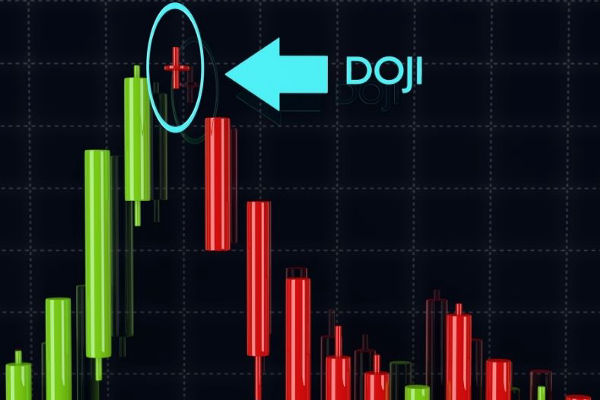
A Doji candlestick forms when the open and close prices of an asset are virtually equal. It creates a candle with a very small or nonexistent real body and longer upper and lower shadows (wicks). In essence, a Doji reflects indecision in the market, where neither buyers nor sellers are in control.
In candlestick charts, a Doji is a transitional signal. It doesn't always indicate a reversal on its own, but when combined with other patterns or indicators, it can provide key insights into upcoming price direction.
Anatomy
Open and Close Prices: These are nearly the same.
Upper Shadow: Shows the high price reached during the trading period.
Lower Shadow: Indicates the lowest price reached.
Real Body: Very small or absent due to the minimal difference between open and closed prices.
This unique shape is what makes the Doji so effective as a signal of market uncertainty or potential change.
A Doji is primarily a neutral pattern, but its implications depend heavily on its context within a trend. Here's how it's commonly interpreted:
In an Uptrend: A Doji may indicate that bullish momentum is weakening, potentially signalling a trend reversal or consolidation.
In a Downtrend: It could suggest that selling pressure is fading, leading to a potential bullish reversal.
At Support or Resistance: A Doji near key support and resistance levels can provide added confirmation of a potential breakout or reversal.
Doji Candlestick in Different Markets
1) In Forex
Doji patterns in the forex market are especially relevant due to 24-hour trading and high volatility. Use them with currency-specific news and economic indicators.
2) In Stocks
Stocks often react to earnings and news events. A Doji after earnings can indicate market hesitation or uncertainty about the company's future.
3) In Commodities and Indices
In these markets, Dojis often occur around key geopolitical or macroeconomic events. Watch closely for reversal or continuation signs after such events.

1. Standard Doji
The most basic form, the Standard Doji, has nearly equal upper and lower wicks with a small body. It signals a balance between buyers and sellers.
2. Long-Legged Doji
This version has long upper and lower shadows, indicating high volatility and indecision. It often appears after strong trends and can signal exhaustion.
3. Dragonfly Doji
This Doji has a long lower shadow and almost no upper shadow. It often appears after a downtrend and can indicate a potential bullish reversal.
4. Gravestone Doji
The opposite of the Dragonfly, the Gravestone Doji, has a long upper shadow and no lower shadow. It typically forms at the end of an uptrend, signalling a potential bearish reversal.
5. Four Price Doji
In rare cases, the open, high, low, and close are all the same. This pattern is extremely uncommon and signifies a complete lack of volatility and decision-making.

1. Identify the Trend
Before reacting to a Doji, understand the prevailing trend. Is the market in a strong uptrend, downtrend, or moving sideways?
2. Look for Contextual Clues
Observe where the Doji forms:
Near support zones? Potential bullish reversal.
Near resistance zones? Possible bearish reversal.
3. Wait for Confirmation
A Doji on its own is not a trade signal. Wait for the next candlestick to confirm the move:
Bullish Confirmation: A strong green candle following a Doji after a downtrend.
Bearish Confirmation: A strong red candle following a Doji after an uptrend.
4. Use Technical Indicators
Combine the Doji with indicators such as RSI, MACD, or moving averages for better accuracy. For example, an oversold RSI and a Doji near support could enhance your confidence in a bullish setup.
5. Set Entry and Exit Points
Once confirmation occurs, set your entry slightly above the confirming candle's high (for long trades) or below the low (for short trades). Place stop-loss orders just beyond the Doji's wick to manage risk.
Example 1: Dragonfly Doji in a Downtrend
You spot a Dragonfly Doji on the daily chart of a stock, forming near a historical support level. The next candle is a strong bullish engulfing pattern.
Strategy:
Enter long above the high of the bullish candle.
Place a stop-loss below the Doji's low.
Target a previous resistance level for profit-taking.
Example 2: Gravestone Doji After Uptrend
A Gravestone Doji appears after several bullish candles, suggesting buyer exhaustion. The following candle is a large bearish candle.
Strategy:
Enter a short position below the bearish candle's low.
Stop-loss above the high of the Gravestone Doji.
Look for support levels to exit the trade profitably.
| Pros | Cons |
|---|---|
| Easy to identify on charts | Requires confirmation to be reliable |
| Works across all timeframes and markets | Not always indicative of a trend change |
| Strong potential for reversals | Can lead to false signals in ranging markets |
| Good addition to a broader strategy | Overuse may lead to overtrading |
In conclusion, the Doji candlestick is a powerful tool in a trader's arsenal, but only when used correctly and in the correct context. Its role in signalling indecision and potential reversals can help traders enter and exit positions more wisely.
Remember: No candlestick pattern is foolproof. Combine the Doji with a comprehensive trading strategy, sound risk management, and emotional discipline for long-term success in the markets.
Disclaimer: This material is for general information purposes only and is not intended as (and should not be considered to be) financial, investment or other advice on which reliance should be placed. No opinion given in the material constitutes a recommendation by EBC or the author that any particular investment, security, transaction or investment strategy is suitable for any specific person.


World's Best Broker