Published on: 2026-03-31
When evaluating investments, whether a fast-growing technology stock or a broad market ETF, investors often face a key question: how fast is my money really growing? Returns can fluctuate significantly from year to year, making it difficult to assess true performance.
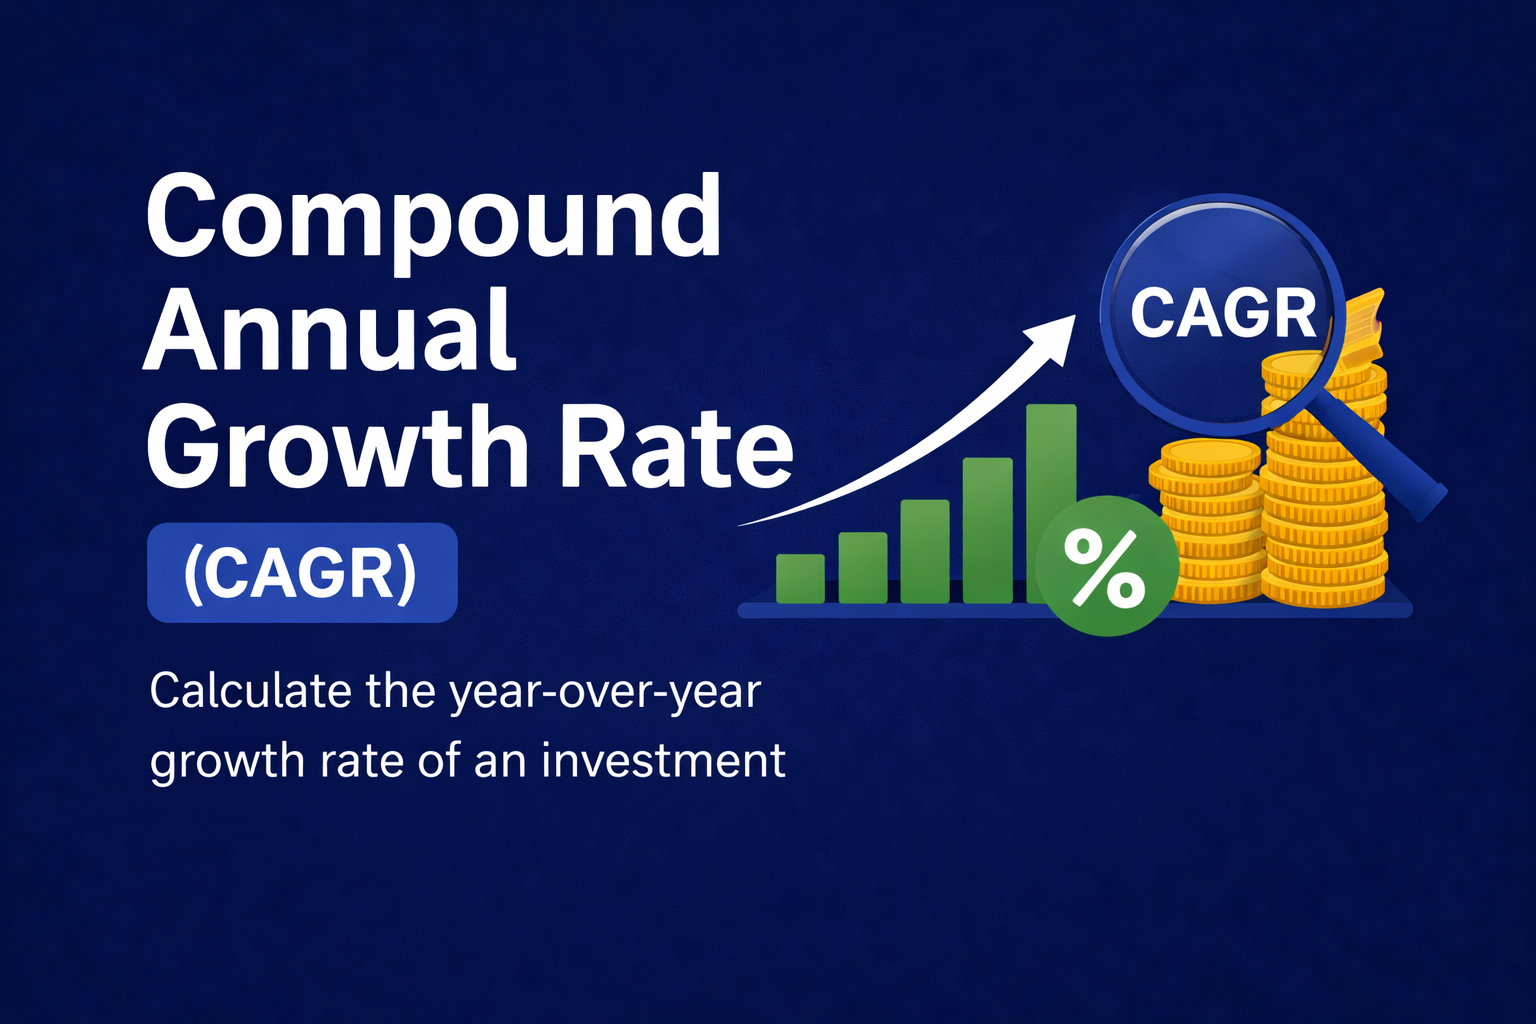
The Compound Annual Growth Rate (CAGR) provides a clear answer by converting uneven returns into a single, annualised growth rate, helping investors understand long-term performance more effectively.
CAGR measures the annualised return of an investment assuming compounding.
It enables fair comparison across different assets and time periods.
CAGR smooths volatility, but can mask risk and fluctuations.
It is most effective for long-term performance evaluation (3 to 5+ years).
CAGR should be combined with other metrics for better decision-making.
Compound Annual Growth Rate (CAGR) represents the rate at which an investment would grow each year if it compounded at a steady pace over a given period.
In simple terms, CAGR answers the question: What constant annual return would take my investment from its starting value to its ending value?

Where:
Ending Value = Final investment value
Beginning Value = Initial investment value
n = Number of years
CAGR is valuable because it converts uneven investment performance into a single, comparable annual growth rate.
Standardisation: Compare stocks, ETFs, and funds on equal footing
Clarity: Filters out short-term noise
Decision-making: Helps assess long-term strategies and consistency
If you invest $10,000 and it grows to $18,000 over 5 years:

This means your investment effectively grew at 12.47% per year, even if actual yearly returns varied.
While CAGR simplifies performance, it can hide volatility.
Average Return = 8.33%
CAGR ≈ 6.2%
Although the investment experienced significant ups and downs, CAGR presents a smoother growth rate. This makes performance appear more stable than it actually was, potentially underestimating risk.
CAGR is widely used to compare long-term performance across index funds.
2026 Context:
Technology and artificial intelligence sectors continue to drive higher growth rates, particularly in data infrastructure, cloud computing, and the semiconductor industry.
High-growth companies (e.g., AI or semiconductor firms) may deliver CAGRs of 15%+ or more.
Mature dividend-paying companies may generate a 6–8% CAGR.
This helps investors align choices with risk tolerance and return expectations.
CAGR helps answer critical questions:
Is your portfolio beating inflation?
Are you outperforming market benchmarks?
Are your returns consistent over time?
CAGR (Compound Annual Growth Rate)
Measures the annualised compounded return of an investment over time.
Limitation: Ignores volatility and assumes smooth growth.
Average Return (Arithmetic Mean)
Calculates the simple average of yearly returns.
Limitation: Can overstate performance when returns are volatile.
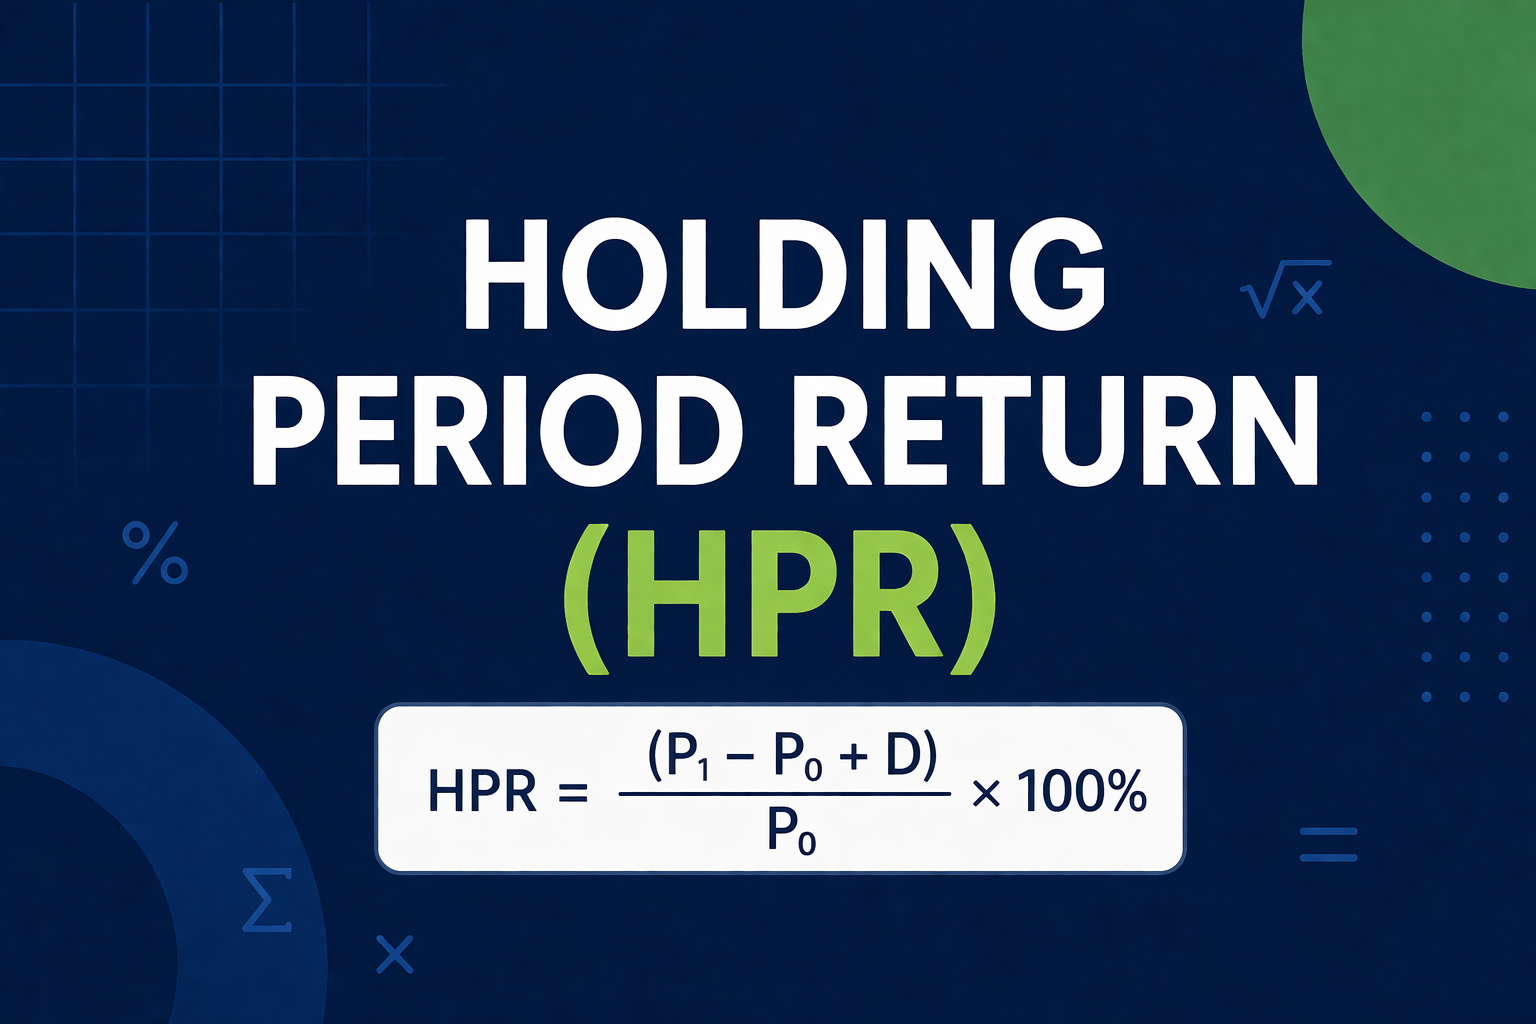
Total Return
Reflects the overall gain or loss of an investment, including price appreciation and income (e.g., dividends).
Limitation: Not adjusted for time, making comparisons less meaningful.
IRR (Internal Rate of Return)
Measures returns while accounting for timing and size of cash flows.
Limitation: More complex and sensitive to assumptions.
CAGR is best suited for long-term growth evaluation, while metrics like IRR are more appropriate when investments involve multiple cash flows.
CAGR is not always the best tool. It is less useful in the following situations:
Short-term trading: Does not reflect rapid changes
Highly volatile assets: Can mask significant drawdowns
Investments with cash flows: Contributions and withdrawals distort results
In such cases, metrics like IRR or time-weighted returns are more appropriate.
It assumes smooth growth, even when returns fluctuate significantly.
Two investments with identical CAGR can have very different risk levels.
Results can vary depending on the chosen start and end dates.
Compare CAGR over consistent timeframes (minimum 3–5 years)
Benchmark against market indices to gauge relative performance
Compare against inflation (typically ~2–4%) to assess real returns.
Combine with risk metrics such as volatility or drawdown.
Use CAGR as a starting point, not a final decision metric.
CAGR shows the annualised rate of growth of an investment over time, assuming compounding. It simplifies performance into a single figure, making it easier to evaluate long-term investments despite fluctuations in yearly returns.
No. CAGR accounts for compounding, while average return simply calculates the arithmetic mean of yearly returns. CAGR provides a more accurate representation of long-term investment growth.
Yes. If an investment declines in value over time, CAGR will be negative, indicating a compounded annual loss rather than growth.
A good CAGR depends on the asset class and market conditions. For equities, a CAGR of around 8–12% is generally strong over the long term, though higher returns typically involve higher risk.
Yes. Adjusting CAGR for inflation gives a “real return,” which reflects the actual increase in purchasing power. This is especially important in periods of rising inflation.
CAGR is a powerful tool for understanding long-term investment performance, as it converts complex, uneven returns into a single annual growth rate. However, it should not be used in isolation. By combining CAGR with risk metrics, inflation considerations, and broader market context, investors can make more informed and balanced decisions.
Disclaimer: This material is for general information purposes only and is not intended as (and should not be considered to be) financial, investment or other advice on which reliance should be placed. No opinion given in the material constitutes a recommendation by EBC or the author that any particular investment, security, transaction or investment strategy is suitable for any specific person.