Published on: 2026-06-26
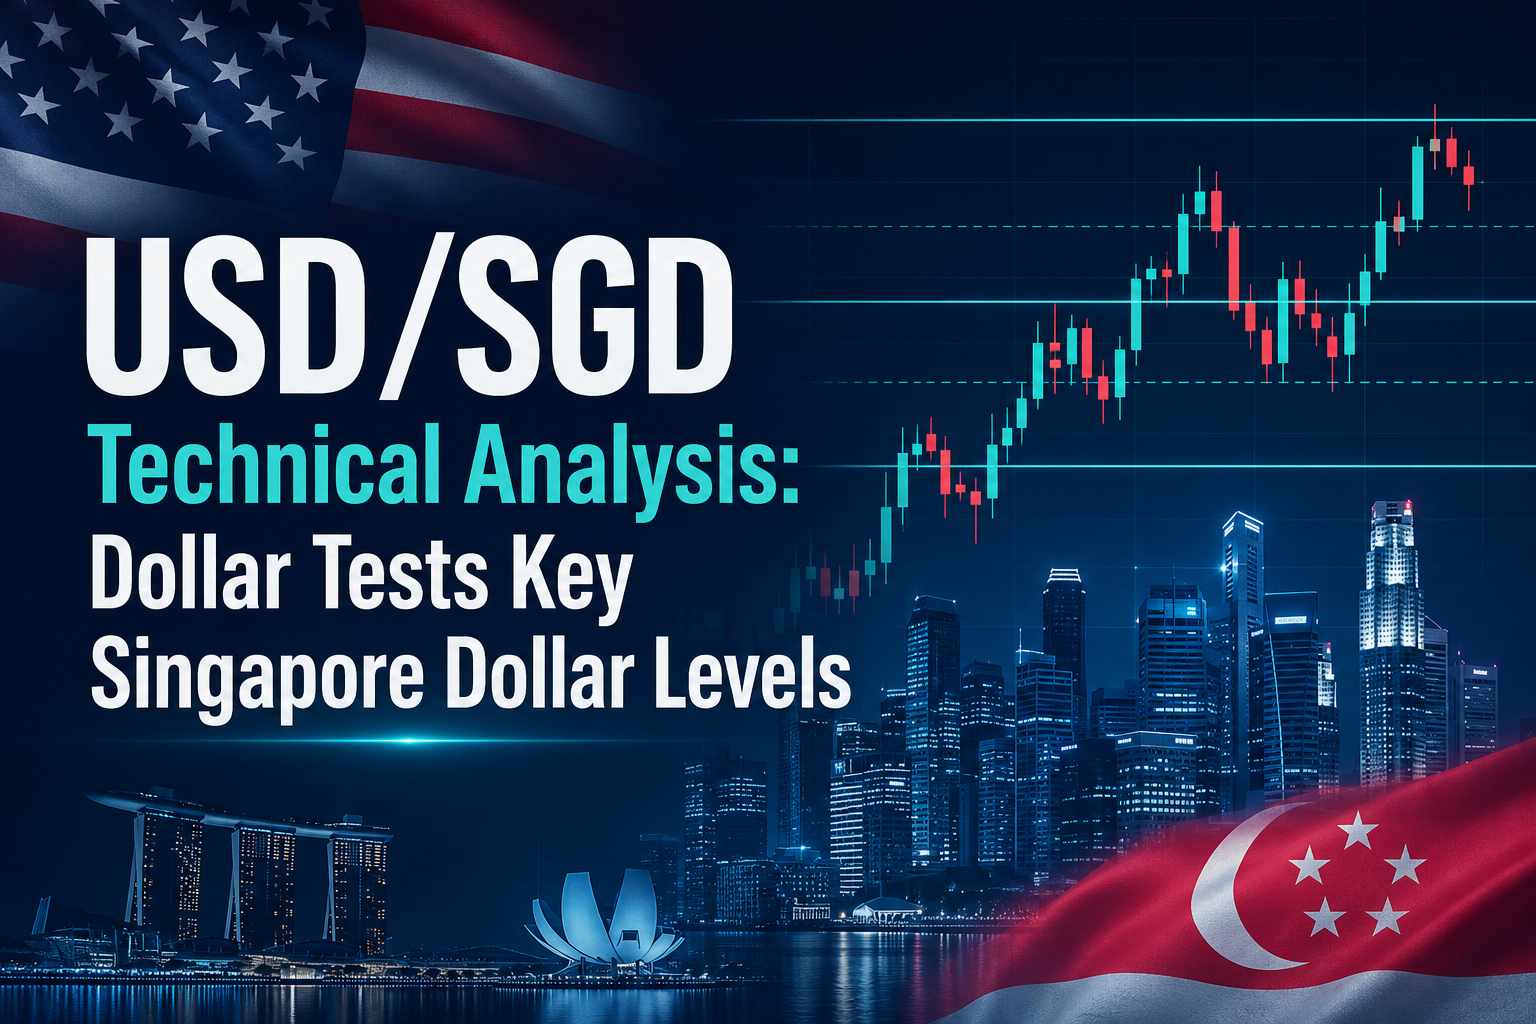
USD/SGD technical analysis is focused on a decisive test of the 1.3000 resistance zone as the dollar-Singapore pair trades near the top of its 2026 range. The pair has climbed on broad US dollar strength and cautious Asian FX sentiment, but the rally is now approaching a level where momentum needs confirmation rather than assumption.
The technical readings below reflect late-June 2026 market conditions and should be refreshed against live charts before publication, as USD/SGD signals can shift quickly with dollar momentum, US yields, and regional risk sentiment.
USD/SGD trades around 1.2944, near its 2026 high of 1.2979 and well above the January low of 1.2609.
Price sits above its 20-day, 50-day, 100-day, and 200-day moving averages, keeping the trend tilted toward the dollar.
Momentum is supportive but stretched: RSI has moved into overbought territory, while MACD is positive but not a clean standalone breakout signal.
The pivotal level is 1.2970 to 1.3000; a confirmed close above it opens 1.3050 to 1.3080.

| Indicator | Current signal | Interpretation |
|---|---|---|
| Spot USD/SGD | ~1.2944 | Near the upper end of the 2026 range |
| 2026 high | ~1.2979 | Immediate breakout zone |
| 2026 low | ~1.2609 | Major downside reference |
| 20-day EMA | ~1.2872 | Short-term trend support |
| 50-day EMA | ~1.2824 | Medium-term bullish filter |
| 200-day SMA | ~1.2837 | Long-term trend support |
| RSI 14 | ~76.4 | Overbought; upside momentum is stretched |
| MACD | Positive | Supports trend, but confirmation still needed |
| Near-term resistance | 1.2970 to 1.3000 | Break above confirms stronger USD momentum |
| First support | 1.2900 to 1.2920 | Initial pullback area |
| Deeper support | 1.2780 to 1.2800 | Former range base and trend support |
| Bias | Mild bullish / breakout watch | USD supported, but stretched |
Values are approximate as of late June 2026 and must be updated before publishing.
USD/SGD has climbed from its January low near 1.2609 to recent highs around 1.2979. The advance has been a steady grind with shallow, bought-up dips, and price is now consolidating just under the 1.2970 to 1.3000 resistance zone.
The next decisive daily close should set the near-term tone. A close above 1.3000 would confirm a breakout attempt, while failure to hold 1.2900 would turn attention back to deeper support.
Immediate resistance is the 1.2970 to 1.3000 band, anchored by the round-number 1.3000 handle. A confirmed break above this zone opens 1.3050 to 1.3080.
On the downside, first support sits at 1.2900 to 1.2920, followed by the 1.2780 to 1.2800 range base. The 1.2609 January low remains the major downside reference if the broader trend breaks. Until 1.3000 is cleared on a closing basis, the overhead zone remains resistance rather than confirmation.
Yes. USD/SGD trades above its key short-, medium-, and long-term moving averages, which keeps the technical structure tilted toward the dollar. The 20-day EMA near 1.2872, 50-day EMA near 1.2824, and 200-day SMA near 1.2837 all sit below spot price.
That alignment supports a bullish bias, but not an aggressive one. A pullback that holds above the 20-day or 50-day average would support trend continuation. A daily close below the 50-day line would warn that the dollar’s momentum is fading.
Momentum is supportive but stretched. RSI has moved above the 70 overbought line, showing strong recent buying pressure but also warning that the pair may be vulnerable to a pause or pullback if price fails to clear 1.3000.
MACD remains positive, but it should not be read in isolation. The cleaner confirmation would be a daily close above 1.3000 with MACD still rising and price holding above the breakout zone after the move. Without that, momentum risks looking extended rather than decisive.
The bullish case needs a trigger, not a probe. A sustained daily close above 1.3000 would confirm a breakout and open 1.3050 to 1.3080.
An intraday move above 1.2979 that fades back into the range would be less convincing. For breakout traders, the stronger setup is a close above 1.3000 followed by price holding that level as support.
A rejection at 1.2970 to 1.3000 and a break below 1.2900 would tilt the balance back toward the Singapore dollar. That would expose 1.2780 to 1.2800, where prior range support and moving-average signals become more important.
A deeper move below 1.2780 would weaken the bullish structure and shift focus toward 1.2650 to 1.2610, close to the lower part of the 2026 range.
USD/SGD is mildly bullish while it holds above key moving averages and remains near 2026 highs. However, RSI is already stretched, so a clean close above 1.3000 is needed to confirm another leg higher.
Resistance sits at 1.2970 to 1.3000, followed by 1.3050 to 1.3080. Support is at 1.2900 to 1.2920, then 1.2780 to 1.2800.
MACD is positive, but the signal is not strong enough on its own. A stronger confirmation would come from MACD rising while price closes above 1.3000 and holds that level.
USD/SGD stays mildly bullish while it holds above its moving averages and the 1.2900 support shelf, but the trend is not yet in full breakout mode. A confirmed close above 1.3000 opens 1.3050 to 1.3080, while a break below 1.2900 exposes 1.2780 to 1.2800.
Until then, the pair is best read as a bullish range testing resistance, with momentum strong but increasingly stretched.