Published on: 2025-06-24
Updated on: 2026-04-24
The MACD trading strategy is one of the most recognisable tools in technical analysis. Known formally as the Moving Average Convergence Divergence indicator, MACD was developed by Gerald Appel in the 1970s and remains a core component in many trading systems today.
It helps traders read momentum, trend direction and potential reversals based on the relationship between moving averages.
Its value does not come from treating every crossover as a buy or sell signal. The overlooked edge of MACD is how it can add structure to a broader trading plan, especially when it is combined with price action, support and resistance levels, volume indicators and clear risk management.
A MACD trading strategy uses the MACD line, signal line and histogram to assess changes in momentum. Traders commonly watch for signal-line crossovers, zero-line crosses, histogram expansion or contraction, and divergence between price and MACD.
These signals are more useful when they confirm the market structure, rather than when they are used alone.

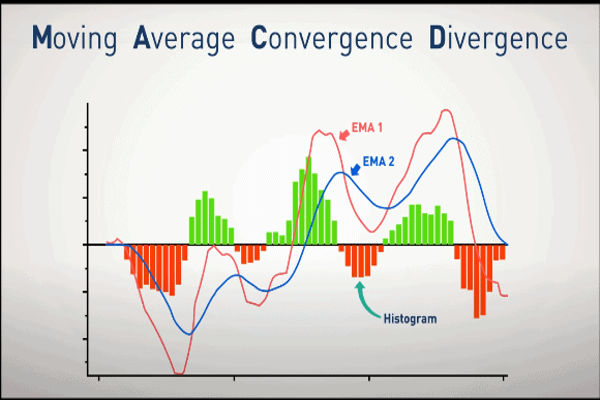
At its core, the MACD trading strategy involves tracking the relationship between two exponential moving averages (EMAs), usually the 12-period and 26-period. The MACD line is created by subtracting the longer EMA from the shorter EMA. A 9-period EMA of the MACD line, known as the signal line, is then plotted to help identify momentum shifts.
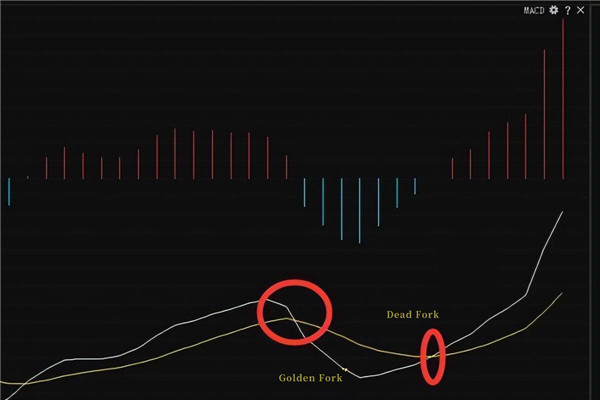
When the MACD line crosses above the signal line, it is commonly interpreted as a bullish momentum signal. When it crosses below, it may indicate bearish momentum. The MACD histogram, which plots the distance between the MACD line and the signal line, helps traders see whether momentum is expanding, weakening or preparing for a possible crossover.

Many modern traders lean towards newer, more complex indicators, often overlooking the simplicity of the MACD trading strategy. That simplicity can be useful because MACD focuses on price-derived momentum and can be applied across forex, commodities, indices and stocks.
MACD tends to be more useful in trending markets, where crossover signals and zero-line moves can help confirm entries and exits. In ranging markets, it can produce frequent false signals, so traders often use it with price structure, higher-timeframe context or a trend-strength filter.
MACD can also help spot divergences between price and momentum, which may warn that a trend is losing strength.
| MACD signal | What it suggests | Stronger use case | Main risk |
|---|---|---|---|
| MACD line crosses above signal line | Bullish momentum may be improving | Use near support, after a pullback, or with a confirmed breakout | False signal in a flat range |
| MACD line crosses below signal line | Bearish momentum may be increasing | Use near resistance, after a failed breakout, or with weakening price structure | Late signal after price has already moved |
| MACD moves above zero line | Trend bias may be turning positive | Use as confirmation that momentum supports a long setup | Can lag during fast reversals |
| MACD moves below zero line | Trend bias may be turning negative | Use as confirmation that momentum supports a short setup | Can arrive after part of the move is over |
| Histogram expands | Momentum is strengthening | Use to stay with a trend after entry | Expansion can fade quickly in volatile markets |
| Histogram contracts | Momentum is weakening | Use as an early warning to review exits or reduce risk | Not always followed by reversal |
| Price and MACD diverge | Current trend may be losing momentum | Use with support, resistance, breakout failure or crossover confirmation | Divergence can persist for a long time |
The true strength of the MACD trading strategy lies in how it is integrated into a broader trading system. Used in isolation, it can provide false signals, especially in choppy conditions. When paired with price action analysis, support and resistance levels or volume indicators, it can provide a more useful confirmation signal.
For instance, a MACD crossover at a key support level may carry more weight than a crossover in the middle of a flat range. Similarly, when the MACD confirms a breakout by moving above the zero line while the histogram expands, traders may have stronger evidence that momentum supports the move.
One of the biggest errors traders make with the MACD trading strategy is treating it as a standalone buy or sell signal. Like all indicators, MACD is a tool, not a crystal ball. It should be used in context.
Another common mistake is ignoring timeframes. The MACD can show bullish signals on a 1-hour chart while showing bearish momentum on the daily chart. Without checking the higher timeframe, traders may act on short-term noise while the broader trend is still moving in the opposite direction.
Finally, overtrading MACD crossovers can lead to whipsaw losses. The strategy works best when the crossover is supported by trend direction, price structure, volatility conditions and a predefined exit plan.

One of the most useful elements of the MACD trading strategy is its ability to detect divergence. When price makes a new high but the MACD does not, it may signal that upward momentum is weakening. When price makes a new low but MACD forms a higher low, it may suggest that selling pressure is fading.
Bearish divergence can alert traders to review long positions, tighten stops or wait for extra confirmation before adding exposure. Bullish divergence, on the other hand, may highlight a possible reversal area in a downtrend, especially when price is also testing a major support level.
Divergence signals do not appear on every chart, and they should not be treated as automatic reversal signals. Their value is highest when they align with support or resistance, a crossover signal, a shift in the histogram or a change in market structure.
| Trading style | Possible MACD setting | What it does | Editorial caution |
|---|---|---|---|
| Intraday trading | 5, 13, 8 | Reacts faster to short-term momentum shifts | More sensitive to whipsaws and noise |
| Standard swing trading | 12, 26, 9 | Balances responsiveness and smoothing | Still needs confirmation from price structure |
| Longer-term analysis | 19, 39, 9 or slower settings | Filters more short-term noise | May react later to turning points |
While the default settings (12, 26, 9) are widely used, traders can adjust the MACD trading strategy to suit different timeframes and market conditions. Shorter settings, such as (5, 13, 8), make the indicator more responsive but can increase false signals. Longer settings smooth the signal and may suit swing trading or position trading, but they can also react more slowly.
Backtesting and forward testing are essential before using adjusted settings in live market conditions. Every market behaves differently, and settings should be judged by consistency, risk control and fit with the trader’s timeframe, not by a single successful trade.
Consider a scenario where a trader spots a MACD bullish crossover on a 4-hour chart of gold. The histogram starts to widen, suggesting that upward momentum is improving. Price is also testing a previously respected support zone.
By combining the MACD trading strategy with market structure and risk management, the trader can define an entry trigger, invalidation level and exit plan before taking the trade.
Another scenario involves bearish divergence on a major index chart. Price pushes to a higher high, but MACD forms a lower high, suggesting that momentum is not confirming the move. A trader may respond by reducing position size, tightening stops or waiting for a confirmed breakdown before acting.
These scenarios show that the MACD trading strategy is most useful when it is applied with context. The signal itself is only one part of the decision; market structure, volatility, position sizing and exit planning remain essential.
The best MACD trading strategy depends on the trader’s timeframe, market and risk rules. A practical approach is to use MACD crossovers, zero-line signals, histogram shifts and divergence as confirmation tools rather than standalone entry signals.
MACD is generally more useful in trending markets. In ranging markets, the MACD line can cross the signal line frequently, which may create whipsaw signals.
The standard MACD settings are 12, 26 and 9. These represent the shorter EMA, longer EMA and signal line. Traders may adjust the settings for faster or slower signals, but any change should be tested before use.
Traders can reduce false MACD signals by checking the higher timeframe, using support and resistance levels, confirming the signal with price action analysis, and applying clear risk management rules.
MACD can warn that momentum is changing, especially through divergence, but it does not predict reversals with certainty. A divergence signal is stronger when it is confirmed by price structure, a crossover or another momentum shift.
The MACD trading strategy offers traders a balance of simplicity and depth. It is not a complete trading system on its own, but it can be a useful part of a technical analysis process. Its ability to confirm trends, identify momentum shifts and highlight divergence makes it valuable across different market conditions.
Most importantly, its edge lies not only in its settings, but in how the trader applies it. Those who look beyond basic crossovers often find that the real advantage of the MACD trading strategy is how it sharpens decision-making, filters weak signals and supports disciplined risk control.