Published on: 2025-09-29
Mastering the break and retest strategy can help traders identify high-probability entry points and boost consistency in the markets.
By understanding how price breaks key levels and then retests them, you gain a clearer signal of market direction.
In this article, we'll break down what break and retest is, how to spot it in real trading, and practical techniques to use it for consistent profits.

The Break and Retest strategy is a cornerstone of technical trading, designed to provide traders with high-probability entry points.
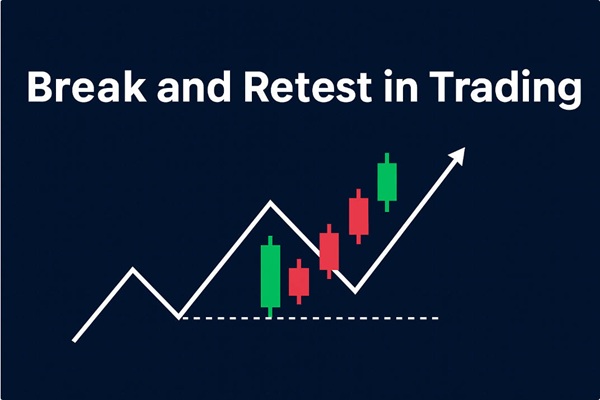
A breakout occurs when the price moves beyond a significant support or resistance level, signalling a potential trend change. A retest happens when the price returns to that broken level, confirming the breakout's validity.
Traders use the Break and Retest strategy to filter out false breakouts, enter trades at better price points, and manage risk effectively. It follows the principle of buying low and selling high while avoiding impulsive decisions.

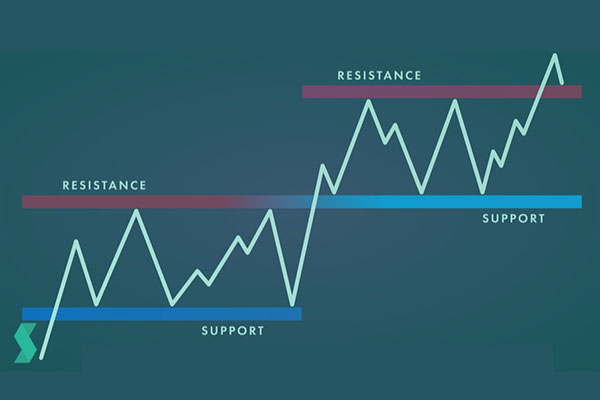
Support and resistance levels are critical in trading. Support is a price level where demand exceeds supply, preventing the price from falling further, while resistance is where supply exceeds demand, preventing upward movement.
When a breakout occurs, it shows a shift in market sentiment. The retest then acts as a confirmation point—price returning to the broken level tests whether the breakout is genuine.
Market psychology plays a key role here: traders who missed the initial breakout often enter on the retest, providing liquidity and momentum for the next move.
To maximise success, it's important to identify strong setups:
Support and Resistance Levels: Look for areas where price repeatedly reverses.
Trendlines and Channels: Diagonal levels provide dynamic support and resistance.
Chart Patterns: Triangles, flags, and rectangles often precede breakouts.
Volume Analysis: Strong breakouts are accompanied by increased volume, confirming market interest.
Timeframes: Longer timeframes generally produce more reliable breakouts, while shorter ones are suitable for intraday opportunities.
| Pattern Type | Description | Market Implication | Example Signal |
| Support Break & Retest | Price breaks below support, then retests it from below | Bearish continuation | Enter short if retest fails |
| Resistance Break & Retest | Price breaks above resistance, then retests it from above | Bullish continuation | Enter long if retest holds |
| False Break | Price briefly breaks level but returns | Market indecision | Avoid entry until clear confirmation |
| Trendline Retest | Price breaks a trendline, then retests it | Trend continuation | Enter in the direction of the trend |
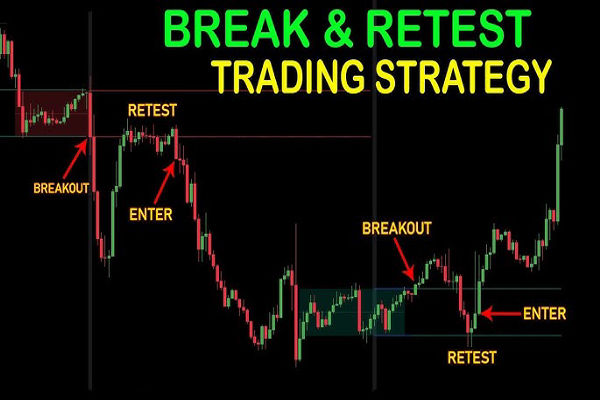
Mark horizontal and diagonal support/resistance levels where price has historically reacted.
Observe for price movement beyond these levels, ideally accompanied by increased volume.
Allow the price to return to the broken level. Confirm that the level holds.
Use candlestick patterns (e.g., pin bars, engulfing candles) or indicators (RSI, MACD) for entry confirmation.
Place stops below support or above resistance. Determine take profit using risk-reward ratios (minimum 1:2 recommended).
Enter the trade, monitor price action, and adjust stops if necessary.

Indicators Combination: Use RSI, MACD, or moving averages to enhance confirmation.
Trending vs. Ranging Markets: Retests are more reliable in trending markets; in ranging markets, be cautious of false breakouts.
Handling False Breakouts: Wait for candlestick confirmation on the retest before entering.
Scaling Positions: Consider partial entries on retest confirmation and add to the position as momentum continues.
Multiple Time Frame Analysis: Confirm the breakout on higher timeframes for stronger validation.
Entering Too Early: Avoid jumping in immediately after the breakout. Wait for the retest.
Ignoring Volume: Low-volume breakouts are less reliable.
Overtrading: Focus only on high-quality setups.
Poor Risk Management: Always define stop loss, take profit, and position size.
Forex: EUR/USD breaks above a 1.1000 resistance level, retests it, and continues upward.
Stocks: Company XYZ breaks past long-term resistance at $50. retests, then rallies to $55.
Cryptocurrency: BTC/USD breaks a channel, retests, and resumes its uptrend.
A retest occurs when the price returns to a previously broken support or resistance level, confirming a breakout before entering a trade.
Look for price moving beyond a key level with strong volume. The retest should hold the broken level.
Yes, it works in forex, stocks, commodities, and cryptocurrencies, as long as clear levels are identifiable.
Use stop losses, proper position sizing, and only enter trades with confirmed retests.
It can work on multiple timeframes, but higher timeframes generally provide stronger, more reliable breakouts.
Wait for confirmation during the retest and check for volume support. Avoid trading immediately on the breakout.
RSI, MACD, moving averages, and volume indicators can help confirm the breakout and retest strength.
It works best in trending markets. In ranging markets, false breakouts are more common, so extra caution is needed.
The Break and Retest strategy allows traders to enter the market with higher probability setups and lower risk. Patience, discipline, and robust risk management are key to success.
By combining technical analysis, volume observation, and retest confirmation, traders can significantly improve their decision-making and maximise profit potential.
Disclaimer: This material is for general information purposes only and is not intended as (and should not be considered to be) financial, investment or other advice on which reliance should be placed. No opinion given in the material constitutes a recommendation by EBC or the author that any particular investment, security, transaction or investment strategy is suitable for any specific person.