In the world of trading, fundamental and technical analysis are the two primary methods. Fundamental analysis focuses on the specifics of the underlying asset, such as the company's business model and financial health, while technical analysis involves studying market trends and using various technical indicators to predict price movements. To excel in technical analysis, investors need to understand and effectively apply a range of technical indicators. Let’s now explore these indicators, their uses, and key considerations.
Understanding Technical Indicators
Technical indicators are quantitative data based on historical price and volume data of a stock or market, calculated through mathematical formulas and used to analyze market trends and predict future price changes. They help investors and traders identify market trends, timing of buying or selling, and potential market reversal points.
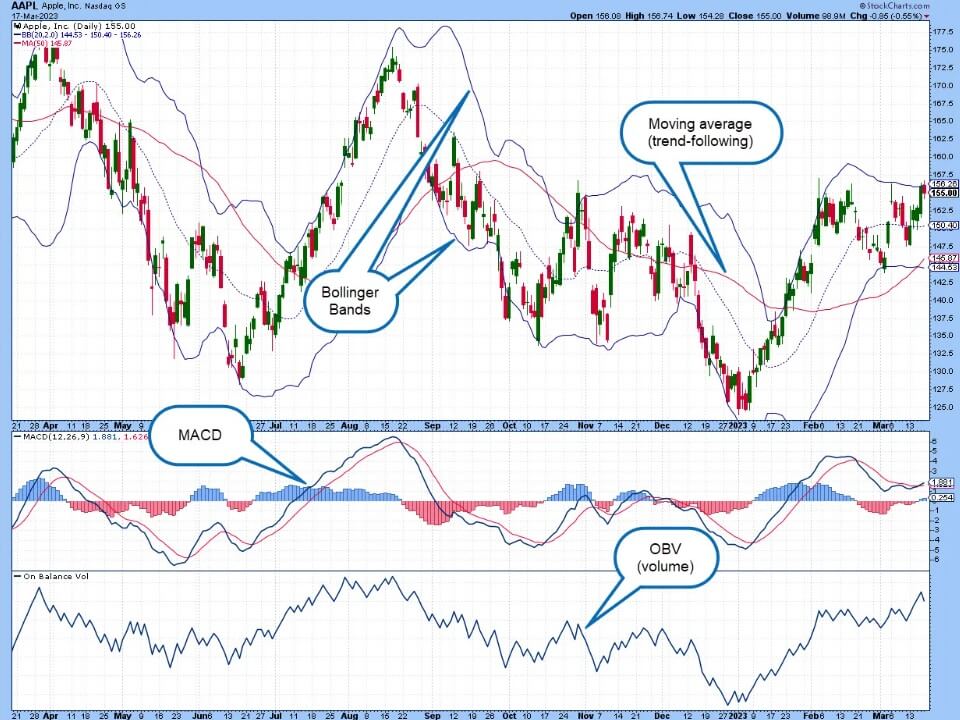
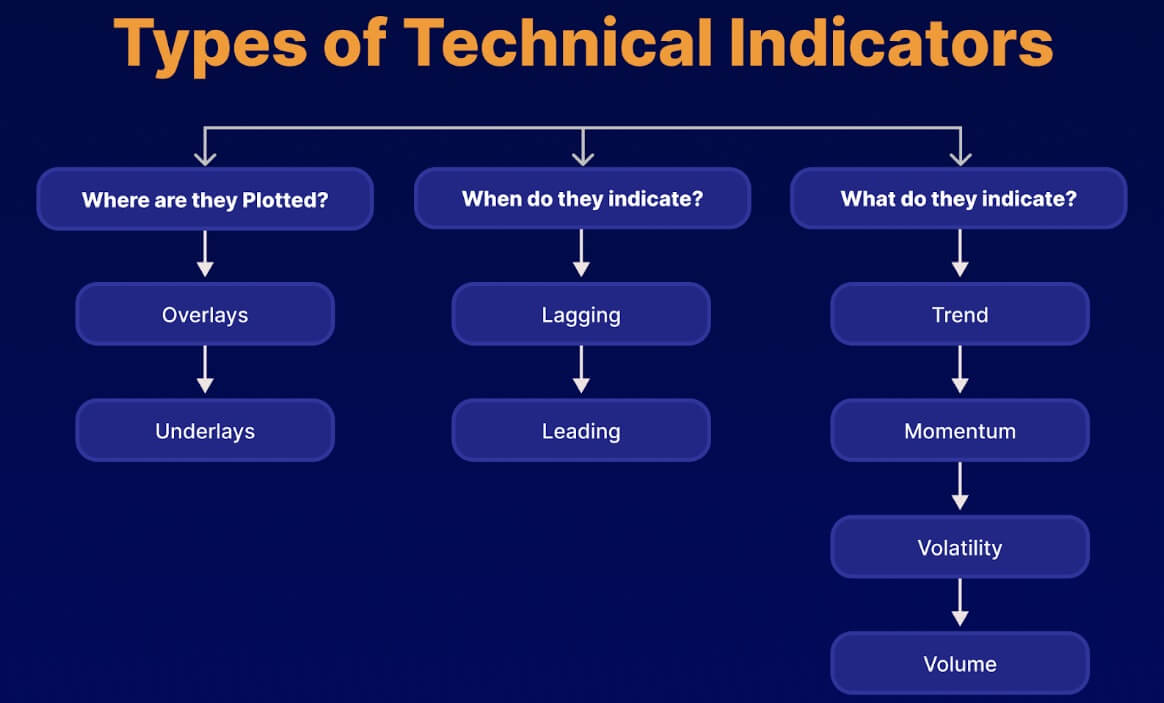
Technical indicators can usually be categorized into types such as trend indicators, momentum indicators, volatility indicators, and volume indicators. Each type of indicator provides different information about the market: trend indicators help identify the overall direction of the market, momentum indicators measure the speed and strength of price movements, volatility indicators assess the range of the market's fluctuations, and volume indicators confirm the strength of the trend and possible market turning points. Using a combination of these indicators allows for a comprehensive analysis of market conditions from multiple perspectives and improves the accuracy of investment decisions.
Among the trend indicators, the main ones include Moving Average (MA), Average Convergence Index (ADXADX), and Moving Average Convergence Divergence (MACD). These indicators help investors to grasp the main direction of the market in different ways so that they can develop more effective trading strategies. Moving averages show long-term trends by smoothing price data, helping to confirm whether the market is in an upward or downward trend. The Average Convergence Index (ADX), on the other hand, focuses on measuring the strength of a market trend, assessing the persistence of the trend and how strong it is.
In addition, the MACD combines short-term and long-term moving averages to provide market trend movement and potential reversal points. The crossover of the MACD line with the signal line, as well as changes in the MACD histogram, help investors identify changes in trend and timing of buying and selling. By using these trend indicators in combination, investors can have a clearer grasp of the market trend and improve the accuracy of their trading decisions.
Momentum indicators, such as the Relative Strength Index (RSI) and stochasticstochastic (KDJ), are mainly used to measure the speed and strength of price movements. These technical indicators help investors to understand the momentum changes in the market and thus optimize the timing of buying and selling. The RSI assesses the overbought or oversold state of the market by comparing the average upside to the average downside over a certain period of time, which in turn helps to identify possible price reversal points.
On the other hand, KDJ reveals overbought or oversold areas of the market by calculating the relationship between the high, low, and closing price of the price over a certain period. These momentum indicators provide signals about overbought or sold markets, helping investors to make trading decisions at the right time and avoid entering and exiting the market under unfavorable conditions.
Volatility indicators, such as Bollinger Bands and Average True Range (ATR), are used to help investors understand the level of volatility in the market so that they can develop more appropriate trading strategies. Bollinger bands set upper and lower tracks by calculating the standard deviation of prices. These tracks show the range of volatility in the market and help identify potential overbought or oversold conditions. Prices hitting the upper and lower Bollinger Band tracks usually signal a possible turning point in the market.
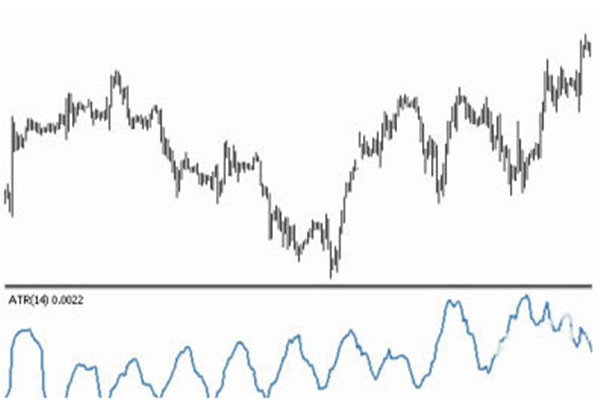
On the other hand, the Average True Range (ATR) measures the magnitude of price fluctuations over time and provides a quantitative indicator of market volatility; an increase in ATR indicates an increase in volatility, which may be accompanied by an increase in price movement, while a decrease in ATR indicates a decrease in volatility and a smaller price movement. By using these two volatility indicators, investors can better assess the risks and opportunities of the market and thus optimize their trading strategies.
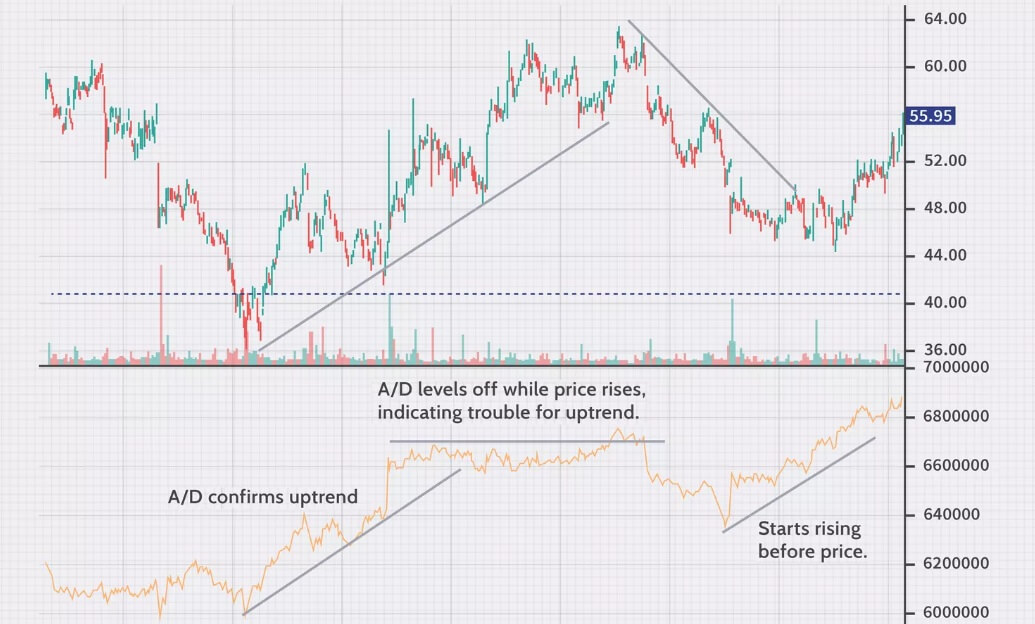
Volume indicators, including volume and the Accumulation/Distribution Line (ADL), help identify the strength of trends and potential reversal signals. Volume shows the amount of trading activity and helps to determine the degree to which the market agrees with a price movement. An increase in volume usually indicates that a trend is likely to continue, while a decrease may signal a weakening or reversal of the trend.
The accumulation/dispatch line combines price action with volume to reveal the buying and selling power of the market. When the accumulation/dispatch line rises, it indicates strong buying and prices may rise; when it falls, it may indicate increased selling pressure and downside risk to the market. Used in combination, these indicators provide a more accurate assessment of market trends and reversal points.
These technical indicators provide different perspectives on the state of the market, enabling investors to analyze market movements from multiple angles. Trend indicators help identify the overall direction of the market; momentum indicators measure the strength of price movements; volatility indicators assess the range of the market; and volume indicators confirm the strength of the trend and potential turning points. By combining multiple indicators, investors can take into account a variety of market factors to gain a more comprehensive market analysis and make more informed and effective trading decisions.
How Effective Are Technical Indicators in Stock Trading?
By analyzing historical price and volume data, technical indicators are a very useful tool in stock trading as they help investors identify market trends, determine buying and selling times, and predict price movements. However, although it provides valuable information, it also has limitations, such as lagging and false signals. Therefore, it is best to use him in conjunction with other analytical methods to improve the accuracy of investment decisions.
Technical indicators have significant advantages, especially in trend identification. For example, moving averages (MAs) provide a clear indication of the long-term trend of the market by smoothing price data, enabling investors to better judge the main direction of the market. These indicators can effectively guide investors to follow the trend or adjust their strategies at the right time, thus improving the science and accuracy of trading decisions.
It also plays a key role in the generation of buy and sell signals. For example, the Relative Strength Index (RSI) and MACD (moving average of constant difference difference) can provide investors with clear buy and sell signals. These signals help investors to make decisions at the right time and optimize their trading strategies.
At the same time, technical indicators also play an important role in risk management. Volatility indicators such as Bollinger Bands and Average True Range (ATR) can assess the volatility of the market and help investors set reasonable stop-loss and take-profit points. These tools can effectively control risk and enhance the robustness of investment strategies.
On the market confirmation side, volume indicators play a crucial role. For example, volume and accumulation/distribution linelines can help confirm the validity of price movements. These indicators can increase the reliability of the signal, help investors judge the true extent of the trend, and make more accurate trading decisions.
However, since most technical indicators are calculated based on historical data, they tend to reflect past market movements. As a result, investors may not receive signals until after the market has already changed. This lag may lead to delays in decision-making, thus affecting the timing and effectiveness of investments. Although it can provide valuable reference, in a dynamic market environment, investors should incorporate other analytical tools and methods to improve the accuracy and timeliness of their decisions.
Another limitation of technical indicators is that they may generate false or misleading signals, especially in oscillating markets. Since they rely on historical data for their calculations, indicators may give frequent false buy and sell signals when the market is moving sideways or without a clear trend. These false signals may cause investors to make unnecessary trades, which in turn may lead to losses.
It is one of the limitations of technical indicators that they may show different results in different market environments. For example, in a strong market, certain indicators may be effective in helping to identify trends and buy and sell signals, whereas in a weak or oscillating market, these indicators may perform poorly and generate misleading signals. The same technical pattern may have different effects in different market environments.
In addition, a single technical indicator often fails to fully reflect the complexities of the market, and therefore relying on a single indicator for decision-making may lead to one-sided analyses. In order to obtain a more accurate assessment of the market, investors should combine trend, momentum, volatility, and volume indicators, as well as other analytical methods. This allows for a more comprehensive analysis of market dynamics, thereby increasing the accuracy and effectiveness of decision-making and reducing the potential for misjudgments due to the limitations of a single indicator.
Overall, technical indicators are important tools in stock investing to help analyze market trends and price movements. However, in order to make more accurate investment decisions, they should be combined with fundamental analysis, market news, and personal investment strategies. This will improve the comprehensiveness and accuracy of decisions by taking into account company fundamentals, market sentiment, and investment objectives.
Key Tips for Using Technical Indicators
By applying various technical indicators, such as moving averages, the Relative Strength Index (RSIRSI), and MACD, investors can screen out stocks from a wide range of stocks to identify those that meet specific technical signals. However, it is important to note that the same technical pattern may behave differently in different market environments. Therefore, when using technical indicators for stock selection, it is important to make a comprehensive analysis in conjunction with the overall market trend and the performance of the industry sector in order to improve the accuracy of stock selection decisions.
In a strong market, technical patterns such as the ‘Morning Star’ or the ‘Duck Head’ usually perform well, signaling a rise in share prices. However, in a weak market, these patterns may fail, and prices may continue to fall or move sideways. Therefore, when using technical indicators, you need to adjust your strategy to the market environment to ensure more accurate investment decisions.
Stock selection becomes more difficult when the market is weak. Even if a strong stock with a good pattern is selected, the upside of the stock price is limited due to the overall poor market, and the stock may even face losses. Many investors in the weakweak market are chasing strong stocks, making it easy to be trapped at high levels. Therefore, technical indicators need to be adjusted in a weak market to avoid blindly chasing short-term strong stocks.
Strong stocks have a greater chance of rising when the market is strong. Strong stocks usually attract followers, and the main force dares to pull up the stock price. At this time, the rise of strong stocks tends to continue, and the strong are always strong. In this case, technical indicators can help investors capture opportunities in the market, especially those strong stocks that refuse to adjust.
In technical stock picking, commonly used short-term averages include the 5-day line, the 10-day line, and the 20-day line. A stock price breakout above the 5-day line usually indicates upside momentum in the short term, and if it is accompanied by volume enlargement, the market is more receptive to the stock. For stocks priced between the 5-day line and the 10-day line, a rebound after stepping back on the 10-day line may indicate that the stock has undergone a short-term washout adjustment and is expected to continue to rise. And back on the 20-day line, the stocks need to be carefully analyzed, especially when the stock price has been at a high level. Back Back Back on the 20-day line, there may be a greater risk.
The 20-day SMA is a key support level in technical analysis, representing the average cost of a month. Strong stocks usually do not fall below the 20-day SMA, and once it does, it may trigger selling by technically-minded retail investors, affecting market confidence. Therefore, the main force usually avoids shares falling below the 20-day SMA to maintain market stability. In technical stock selection, investors should focus on whether the stock price can stabilize above the 20-day SMA in order to better grasp investment opportunities and avoid risks.
When using the Relative Strength Technical Indicator for stock selection, preference should be given to those stocks with an upward long-term trend. For example, NVIDIA's Relative Strength line has continued to move higher over the long term, showing strong relative strength even during broader market adjustments, which means that the stock has remained on a steady uptrend amidst market volatility and meets the needs of long-term investors.
In addition, look for stocks whose share prices have yet to make new highs but whose relative strength line is already ahead of the record highs. This usually indicates strong buying interest in the stock from institutional investors, which could drive the share price further up in the future. Stocks like Sientra and DocuSign during 2020 have shown this relative strength, leading the stock to record highs.
To better suit individual investment needs, investors can adjust the relative strength indicator for different investment cycles. For example, for medium- to long-term investors, the SMA can be set to 50 or 200 days to reduce signal interference from short-term market fluctuations and more accurately capture changes in a stock's trend.
The success of technical stock picking not only relies on the indicators themselves but also needs to be combined with the general environment of the market and the specific conditions of individual stocks. When applying technical indicators, investors must be flexible in responding to market changes and adjusting their strategies to avoid mechanized use of indicators. At the same time, risk control is also crucial, especially when the market is weak or individual stocks are high. You should be alert to the risk of retracement and stop profit or stop loss in a timely manner.
Technical Indicators and their Application and Considerations
| Indicator Name |
APPLICATIONS |
Cautions |
| Moving Average (MA) |
Applied to identify long-term trends |
Take care to avoid lagging signals. |
| Average Convergence Index (ADX) |
Measuring trend strength |
Avoid oscillating markets. |
| MACD |
Identify trends and reversals. |
Watch for false signals. |
| Relative Strength Index (RSI) |
Gauge overbought/oversold levels. |
Adjust periods to market conditions. |
| Stochastic (KDJ) |
Reveal overbought or oversold areas |
Avoid misuse in oscillating markets. |
| Bollinger Bands (BBB) |
Assess the market volatility range. |
Check signal validity in strong trends. |
| Average True Range (ATR) |
Measuring market volatility |
Set stops and adjust for volatility. |
| Volume |
Confirming the strength of a trend |
Avoid signals on low volume. |
| Accumulation/Distribution Line |
Identify buying and selling forces. |
Note the matching of price action. |
Disclaimer: This material is for general information purposes only and is not intended as (and should not be considered to be) financial, investment, or other advice on which reliance should be placed. No opinion given in the material constitutes a recommendation by EBC or the author that any particular investment, security, transaction, or investment strategy is suitable for any specific person.
