Options trading attracts investors seeking leverage, hedging opportunities, and short-term profits. In the current financial landscape, identifying the best technical indicators for options trading in 2025 can provide traders with a competitive edge.
This article explores the best indicator for option trading in 2025, supporting indicators and evaluating their effectiveness in modern markets, and explains how traders can use them to make informed decisions.
Why Indicators Matter in Option Trading
Options are complex financial instruments. Unlike traditional stock trading, options involve multiple dimensions—price, volatility, time decay, and implied volatility. It makes it essential to use indicators that provide context beyond price direction. A solid indicator setup can:
Help identify entry and exit points
Assess underlying stock momentum
Measure volatility and risk
Align with options-specific dynamics like delta, theta, and vega
In 2025, the most effective options indicators factor in volatility, time sensitivity, and real-time trend shifts.
The Best Indicator for Option Trading in 2025
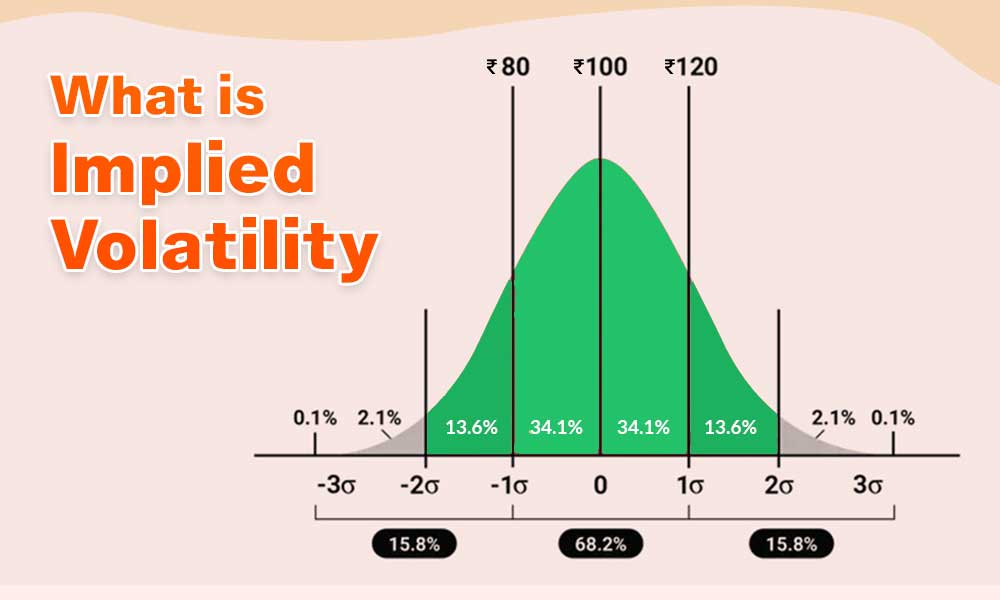
In 2025, many professional options traders consider Implied Volatility Rank (IV Rank) the best indicator for assessing trade timing and premium value. This is because IV Rank directly relates to how expensive or cheap an option is relative to its past volatility.
What Is IV Rank?
Implied Volatility Rank compares the current implied volatility of an option to its volatility range over a given time period (usually the last 12 months). It's a percentage measure telling whether IV is high or low relative to its historical norms.
Why IV Rank Works Well in 2025
In the current environment of unpredictable macroeconomic shifts, geopolitical risks, and algorithmic volatility surges, IV Rank allows traders to:
This is especially important in a market dominated by earnings trades, event-driven strategies, and weekly options.
Supporting Indicators for Better Accuracy
While IV Rank may be the most crucial indicator in options trading today, successful traders rarely rely on one tool alone. Combining it with price and momentum indicators creates a more complete picture.
1) Relative Strength Index (RSI): Spot Overbought or Oversold Conditions
The Relative Strength Index (RSI) remains a favourite among option traders for timing short-term moves. RSI measures the speed and change of price movements and helps identify overbought or oversold conditions.
In 2025, RSI has gained more traction as traders use shorter time frames and prefer 5-day or 14-day RSI periods for precision entries.
RSI above 70 signals overbought conditions, potentially a time to sell calls or buy puts.
RSI below 30 indicates oversold conditions, ideal for selling puts or buying calls.
Traders often use RSI with IV Rank to choose trades with price momentum and premium pricing.
2) Moving Averages: Trend Confirmation and Entry Timing
Moving averages, especially the Exponential Moving Average (EMA), remain fundamental to options strategies in 2025.
Short-term EMAs like the 8-day and 21-day are preferred for:
For example, a crossover of the 8-day EMA over the 21-day EMA might prompt a trader to initiate a bullish call spread, especially if IV Rank is low and RSI confirms upward momentum.
3) Bollinger Bands: Volatility Breakouts and Reversions
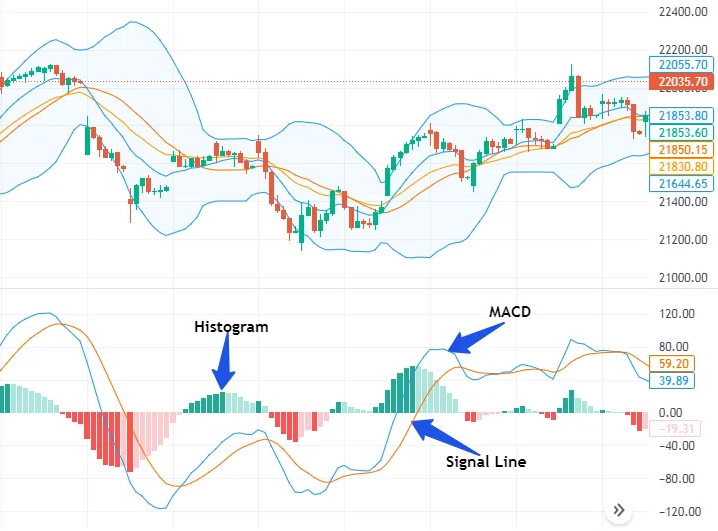
Bollinger Bands are highly useful for option traders because they encapsulate volatility and standard deviation. In 2025, traders often use Bollinger Bands to:
Sell options during range-bound markets (when the price hits upper or lower bands)
Trade breakouts when the price closes outside the bands with volume confirmation
Pair with IV Rank to anticipate mean-reversion trades
When a stock hits the upper band and IV Rank is high, selling a call spread or entering a bearish trade could be a high-probability move.
4) MACD (Moving Average Convergence Divergence): Trend Strength and Momentum
MACD helps confirm trend direction and momentum shifts. While RSI is often more reactive, MACD gives a clearer view of the longer-term trend.
In options trading, MACD can help:
Filter trades for trend-following strategies
Avoid whipsaws in choppy conditions
Confirm directional plays (like long calls or puts)
In 2025's high-frequency market, MACD histogram divergences can help detect early reversals.
5) Volume Indicators: Smart Money Confirmation
Volume analysis has become more sophisticated in 2025 thanks to better data access and algorithmic trading tools.
Volume indicators, such as On-Balance Volume (OBV) or Volume Weighted Average Price (VWAP), help traders:
Pairing volume confirmation with RSI or Bollinger Band setups increases the chances of success.
Best Indicator Combinations for Popular Strategies
For Credit Spreads
High IV Rank
RSI at extremes
Bollinger Band touch
This combo lets traders sell premium where reversion is likely.
For Buying Long Calls or Puts
Low IV Rank
MACD crossover
EMA confirmation
This setup helps traders buy options cheaply with directional confirmation.
For Iron Condors
Traders profit from time decay in range-bound conditions.
How to Choose the Right Indicator for You
The best indicator isn't just about statistical accuracy. It depends on your:
Trading style (directional vs neutral)
Time frame (intraday, weekly, monthly)
Risk appetite
Experience level
For beginners, sticking with IV Rank and RSI can offer a simple yet powerful foundation. Intermediate traders might add Bollinger Bands and Greeks. Advanced traders often use custom scans combining 4–6 indicators for higher precision.
Conclusion
If you had to pick just one indicator for option trading in 2025, Implied Volatility Rank (IV Rank) stands out. Its ability to show relative premium pricing is unmatched.
However, real success comes from combining IV Rank with technical indicators like RSI, Bollinger Bands, and moving averages.
Disclaimer: This material is for general information purposes only and is not intended as (and should not be considered to be) financial, investment or other advice on which reliance should be placed. No opinion given in the material constitutes a recommendation by EBC or the author that any particular investment, security, transaction or investment strategy is suitable for any specific person.
