Published on: 2025-09-29
Updated on: 2026-05-06
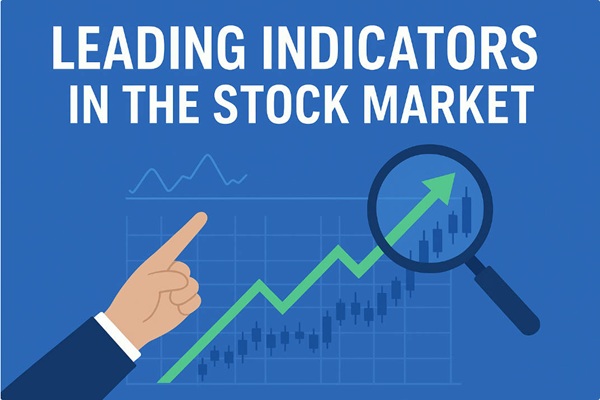
Leading indicators in the stock market are data points, market signals, or sentiment measures that may turn before prices, earnings, or the wider economy do. They do not predict outcomes with certainty, but they can help investors spot changing risk conditions earlier.
This guide explains the main categories of leading indicators: economic, technical, and sentiment indicators. It also shows how to combine them, where false signals can appear, and why risk management is still essential when using early market signals.
A leading indicator aims to signal a possible change before it appears in stock prices or economic data.
A lagging indicator confirms what has already happened, such as reported earnings or unemployment trends after a slowdown has begun.
A coincident indicator moves broadly with current conditions. In practice, investors should treat leading indicators as alerts, not as trading instructions.

Economic conditions shape equity valuations, corporate earnings expectations, and investor risk appetite. Macro leading indicators are useful because they can change before official growth, inflation, or earnings data fully reflect a turning point.
The yield curve compares yields on short-term and long-term government bonds. A commonly watched U.S. measure is the 10-year Treasury yield minus the 3-month Treasury yield.
The Federal Reserve Bank of New York uses this term spread to estimate the probability of a U.S. recession 12 months ahead, so investors often treat curve inversion as an early warning signal rather than a precise market-timing tool.
The Purchasing Managers' Index (PMI) tracks survey responses from business managers on areas such as new orders, production, employment, supplier deliveries, and inventories.
A reading above 50 usually signals expansion in the surveyed sector, while a reading below 50 signals contraction. New orders are especially useful because they can weaken before production and earnings slow.
Consumer confidence surveys track how households view jobs, income, inflation, and future financial conditions.
Because consumer spending is a major driver of many developed economies, a sharp fall in confidence can warn that revenue expectations for consumer-facing companies may weaken.
Initial unemployment claims show how many people are newly filing for jobless benefits. A persistent rise can be an early sign that labour-market conditions are cooling, which may reduce household spending and pressure earnings expectations. Use this signal with other labour data, as weekly claims can be volatile.
Organisations such as The Conference Board compile composite indexes that combine several forward-looking signals into one measure.
The Conference Board’s U.S. Leading Economic Index (LEI) includes 10 components, including manufacturing new orders, building permits, the S&P 500, the interest-rate spread, and consumer expectations.
Its U.S. LEI declined 0.6% in March 2026 to 97.3, showing how composite indicators can summarise changing economic momentum in one data point.

Many investors also look inside the market for early signals. Technical indicators use price, volume, volatility, and breadth data to identify whether buying or selling pressure is strengthening before the headline index clearly turns.
1) Momentum oscillators such as the Relative Strength Index (RSI) or Stochastic Oscillator attempt to identify when price momentum is stretched. These signals are more useful when they align with trend structure, support and resistance, or volume confirmation.
2) Divergence signals occur when the direction of an indicator differs from price trends. For example, if prices rise but momentum weakens, it may signal a potential reversal.
3) Volume-based tools, including On-Balance Volume (OBV) or the Accumulation/Distribution index, track whether buying or selling pressure is building beneath the price trend. Rising volume during an advance can confirm demand, while weakening volume during a rally may warn that participation is fading.
4) Volatility and breadth indicators, such as the advance/decline line, TRIN, or the Cboe Volatility Index (VIX), help assess whether market strength is broad or fragile. The VIX is designed to reflect the market’s expectation of 30-day S&P 500 volatility and is often used as a fear gauge.
5) Cyclical or seasonal patterns, like the January Barometer or Coppock Curve, are less precise but still used by some traders as forward-looking signals.
Investor sentiment often shifts before fundamentals do, especially near market extremes.
Sentiment indicators are usually contrarian: extreme optimism can signal complacency, while extreme pessimism can signal panic or potential capitulation.
1) Market sentiment indicators including fear and greed measures, investor surveys, and volatility gauges, assess whether investors are excessively bullish or bearish.
2) Options-market signals, such as the put/call ratio, track whether traders are buying more downside protection or more upside exposure.
3) Survey-based indicators, such as the American Association of Individual Investors (AAII) Investor Sentiment Survey, ask investors where they expect the market to move over the next six months.
4) Media and attention indicators, such as news coverage frequency or search trends, can show whether hype or panic is influencing market behaviour. These signals are noisy, so they should be confirmed with price, volume, and macro data.
Relying on leading indicators requires discipline. A practical approach is to build a small dashboard rather than follow one signal in isolation. The goal is to compare macro, technical, and sentiment evidence before adjusting risk.
Traders in fast-moving markets may prefer momentum oscillators, while long-term investors may rely more on economic surveys and composite indexes.
No single indicator is sufficient. A stronger signal usually appears when different categories point in the same direction, such as weakening PMI new orders, deteriorating market breadth, and rising volatility. Conflicting signals should reduce confidence rather than force a trade.
| Dashboard layer | Indicator to watch | What a weakening signal may suggest |
|---|---|---|
| Macro growth | PMI new orders | Future production and earnings momentum may slow |
| Credit and rates | Yield curve / term spread | Bond markets may be pricing weaker future growth |
| Labour market | Initial unemployment claims | Hiring conditions may be cooling |
| Market breadth | Advance/decline line | Fewer stocks are supporting the index move |
| Volatility | VIX | Investors may be paying more for downside protection |
| Sentiment | Investor surveys or put/call ratio | Optimism or pessimism may be reaching an extreme |
Leading indicators are best used as alerts rather than guarantees. Waiting for price confirmation can help avoid false signals.
Historical backtesting helps evaluate whether an indicator has worked under similar conditions.
Stop losses, position sizing, and diversification remain essential when following early signals. Leading indicators can warn that risk is rising, but they cannot define the exact entry, exit, or position size for every investor.

Leading indicators can improve market awareness, but they are far from perfect. Their main value is not certainty. It is earlier preparation when several independent signals begin to weaken together.
The yield curve is a useful example. The New York Fed’s model uses the 10-year minus 3-month Treasury spread to estimate recession probability 12 months ahead, but a recession-risk signal does not tell investors exactly when stocks will peak or bottom.
The same limitation applies to technical indicators. RSI, OBV, and breadth indicators can warn of fading momentum, but they may also produce false reversal signals during strong trends.
The challenge is the trade-off between being early and being accurate. Indicators that give timely warnings often produce more false positives, while indicators that wait for confirmation may react after part of the move has already happened.
Consider a scenario in which the yield curve inverts, PMI new orders fall below 50, and equity market breadth weakens. At the same time, the VIX rises and investor surveys show a rapid shift toward pessimism.
This combination does not guarantee a bear market. However, it suggests that growth expectations, market participation, and investor confidence are weakening together. A long-term investor may reduce concentrated equity exposure, rebalance toward defensive sectors, or raise cash reserves. A short-term trader may wait for price confirmation before entering new positions.
The key is not to react to one data point. The stronger signal comes from several leading indicators confirming the same risk message.
While leading indicators can be powerful, investors must treat them with caution:
They are probabilistic, not certain.
Market regimes change, reducing historical reliability.
Indicators can produce whipsaws—false starts that reverse quickly.
The timing gap between a signal and a market move can be wide, making it difficult to act effectively.
Overreliance on any single indicator increases risk.
Leading indicators give investors and traders a forward-looking toolkit for monitoring possible market turning points. Economic data, technical signals, and sentiment measures each show a different part of the risk picture.
The best approach is to combine several indicators, check whether they agree, and then wait for price confirmation before making major decisions. Used this way, leading indicators can improve preparation and risk control without creating false confidence in any single signal.