Published on: 2025-09-04
Updated on: 2025-09-04
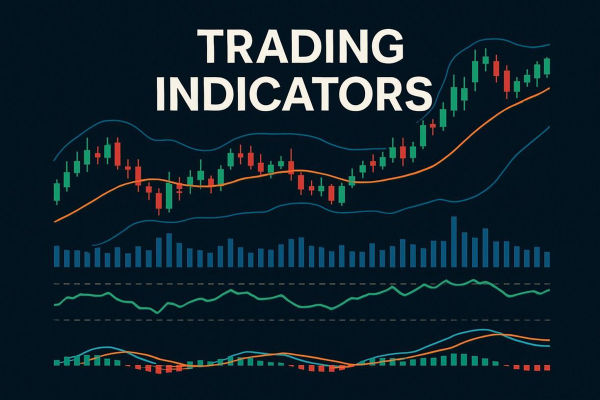
If you are new to trading in 2025, one of the first challenges you'll face is understanding which trading indicators actually work. With numerous indicators available on platforms like MetaTrader 4 (MT4), MetaTrader 5 (MT5), and TradingView, beginners often feel overwhelmed. Some swear by moving averages, while others rely on momentum or volume-based indicators. But which ones are truly reliable?
The answer is that there is no single "holy grail" indicator. Instead, the most successful traders use a combination of indicators to confirm price trends, identify entry and exit points, and manage risk effectively.
In this article, we'll walk you through the 10 most reliable trading indicators for beginners in 2025, explain how they work, and show why they remain relevant in modern markets.

The moving average is among the easiest and most dependable trading indicators. It smooths out price data over a chosen period to help traders identify the general direction of a trend.
How It Works
A simple moving average (SMA) calculates the average price over a set number of periods.
An exponential moving average (EMA) gives more weight to recent prices, making it more responsive to market changes.
Why It's Reliable for Beginners
Moving averages help beginners quickly determine whether the market is in an uptrend, a downtrend, or a ranging market. They are also used as dynamic support and resistance levels.
Example
If the 50-day EMA crosses above the 200-day EMA, it's called a golden cross, a bullish signal.
The RSI is a momentum oscillator that measures the speed and change of price movements. It ranges between 0 and 100.
How It Works
RSI values above 70 indicate overbought conditions (possible price drop).
RSI values below 30 indicate oversold conditions (possible price bounce).
Why It's Reliable for Beginners
RSI is easy to read and helps traders avoid chasing the market. It signals when a price might be due for a reversal or correction.
Example
If EUR/USD has an RSI of 82, it suggests the pair is overbought and may correct lower.

MACD combines moving averages to show changes in momentum, strength, and direction of a trend.
How It Works
It uses two EMAs (usually 12 and 26) and a signal line (9 EMA).
When the MACD line crosses above the signal line, it signals a buy opportunity.
When it crosses below, it signals a sell opportunity.
Why It's Reliable for Beginners
MACD offers a combination of trend-following and momentum assessment, boosting traders' confidence in identifying trend reversals.
Example
On the S&P 500 chart, if the MACD histogram shows increasing positive values, it signals growing bullish momentum.
Bollinger Bands consist of three lines: a moving average in the middle and two bands (upper and lower) plotted based on volatility.
How It Works
When the price touches the upper band, the market is considered overbought.
When the price touches the lower band, the market is considered oversold.
Narrow bands indicate low volatility; wide bands indicate high volatility.
Why It's Reliable for Beginners
Bollinger Bands are excellent for identifying breakouts and reversals. They visually show when markets are too quiet or about to explode with volatility.
Example
If gold (XAUUSD) trades sideways and the bands tighten, traders prepare for a breakout.

Fibonacci retracement levels are horizontal lines based on the Fibonacci sequence, used to identify potential support and resistance levels.
How It Works
Traders analyse retracement percentages such as 38.2%, 50%, and 61.8% to forecast pullbacks in a trend.
Why It's Reliable for Beginners
Fibonacci retracement provides clear entry and exit points, helping beginners manage trades without overthinking.
Example
If Bitcoin rallies from $30,000 to $40,000, a retracement to $36,200 (38.2%) might be a buy opportunity.
The Stochastic Oscillator measures momentum by comparing the closing price to its price range over a given period.
How It Works
Values above 80 = overbought
Values below 20 = oversold
Why It's Reliable for Beginners
It's useful for spotting short-term reversals and works well in combination with RSI.
Example
If Apple stock shows a Stochastic value of 15, it may be due for a rebound.
ATR measures market volatility, not direction. It tells traders how much an asset typically moves in a given time frame.
How It Works
Higher ATR values = more volatility. Lower ATR values = stable market.
Why It's Reliable for Beginners
ATR helps set proper stop-loss and take-profit levels by accounting for volatility.
Example
If GBP/USD has an ATR of 80 pips, traders might set a stop-loss beyond this range to avoid being stopped out by normal volatility.
8. Volume Indicator (On-Balance Volume or OBV)
OBV tracks buying and selling pressure by combining volume with price changes.
How It Works
If price rises with increasing OBV, it suggests strong buying interest.
If price rises but OBV falls, it indicates weakness in the trend.
Why It's Reliable for Beginners
Volume often precedes price moves, making it a powerful confirmation tool.
Example
If Tesla stock rises on high OBV, it confirms institutional buying support.

Ichimoku Cloud is a complex indicator used to analyse trend direction, momentum, and support/resistance levels.
How It Works
If the price is above the cloud, the trend is bullish.
If the price is below the cloud, the trend is bearish.
The cloud's thickness signals market strength.
Why It's Reliable for Beginners
Even though it appears complex, it offers a comprehensive view at a glance, minimising dependence on various indicators.
Example
On USD/JPY, if the price breaks above the cloud, it signals a strong bullish trend.
Parabolic SAR helps identify potential reversal points in a trend.
How It Works
Small dots appear above or below the price.
Dots below price = uptrend.
Dots above price = downtrend.
Why It's Reliable for Beginners
Parabolic SAR is straightforward and gives clear entry/exit points.
Example
If crude oil's chart shows dots flipping below the candles, it indicates a possible uptrend.
Many beginners make the mistake of relying on too many indicators at once. It leads to analysis paralysis. Instead:
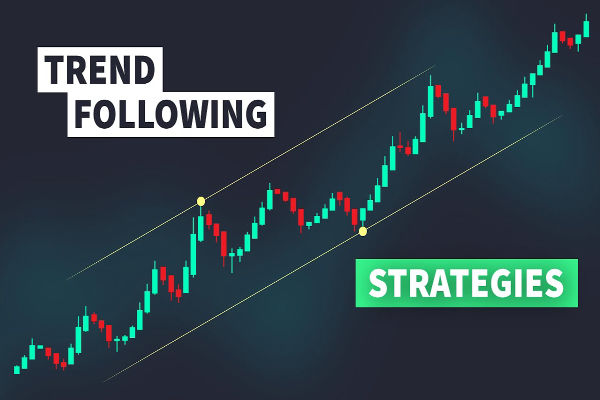
Combine one trend indicator (like MA or Ichimoku) with one momentum indicator (like RSI or Stochastic).
Use a volatility indicator (like ATR or Bollinger Bands) for risk management.
Always confirm signals with price action before entering a trade.
Trading indicators are tools used in technical analysis to help traders analyse price movements, trends, momentum, and volatility. They use mathematical formulas applied to price and volume data to guide buy or sell decisions.
The best indicators for beginners include Moving Averages, RSI (Relative Strength Index), MACD, and Bollinger Bands. These are easy to understand, widely used, and provide clear signals for entry and exit points.
No. Some indicators work best in trending markets (e.g., Moving Averages), while others perform better in ranging markets (e.g., RSI or Stochastic Oscillator). Traders need to adapt indicators to market conditions.
Leading indicators (like RSI, Stochastic) attempt to predict future price movements.
Lagging indicators (Moving Averages and MACD) confirm trends after they start.
Traders often use both for balanced decision-making.
In conclusion, the best strategy for beginners in 2025 is not to chase every indicator but to master a few reliable ones. Moving Averages, RSI, MACD, and Bollinger Bands remain beginner-friendly staples, while more advanced indicators like Ichimoku and Fibonacci retracements offer deeper insights.
The key is to remember that indicators should support your trading plan, not replace it. Always combine them with risk management and market awareness to trade successfully.
Disclaimer: This material is for general information purposes only and is not intended as (and should not be considered to be) financial, investment or other advice on which reliance should be placed. No opinion given in the material constitutes a recommendation by EBC or the author that any particular investment, security, transaction or investment strategy is suitable for any specific person.