Published on: 2026-03-06
Most investors wonder: “How does the S&P change by season”? Seasonality means returns often cluster in certain calendar periods when measured over long time spans.
In equities, this shows up most clearly in month-by-month averages and in the tendency for late fall through early spring to be stronger than late summer. The drivers are usually structural flows and repeated behaviors, not a single cause.

As of early March 2026, with equities trading near recent highs, seasonality primarily informs expectations of historical volatility concentrations rather than predicting short-term price movements.
| Item | Value |
|---|---|
| Instrument | State Street SPDR S&P 500 ETF Trust (SPY) |
| Market | USA |
| Price | $681.31 |
| Change | -$3.62 (-0.01%) |
| Open | $682.13 |
| Intraday High | $687.04 |
| Intraday Low | $675.69 |
| Intraday Volume | 106,606,465 |
| Latest Trade Time | Friday, March 6, 09:15:00 +0800 |
Seasonality means that returns often group together during certain times of the year over long periods. In stocks, this is most obvious in monthly averages and in the pattern where late fall through early spring often performs better.
The reason it persists is not one magic driver. It is a blend of recurring flows, corporate timing, and investor behaviour that can create small edges that become visible only over decades of observation.
The most useful way to read seasonality is probabilistic, not predictive. It answers questions like: “When has the market historically been most vulnerable to drawdowns?” and “When do risk assets typically benefit from supportive flows?” That framing is more realistic than expecting the same pattern to repeat every year.
If the goal is relevance to today’s market structure, the 1980-to-present average S&P return is a strong baseline. It captures the Volcker disinflation aftermath, the rise of passive investing, multiple rate cycles, and the modern derivatives market.
| Month | Average Return |
|---|---|
| January | +0.94% |
| February | +0.19% |
| March | +0.85% |
| April | +1.54% |
| May | +1.08% |
| June | +0.44% |
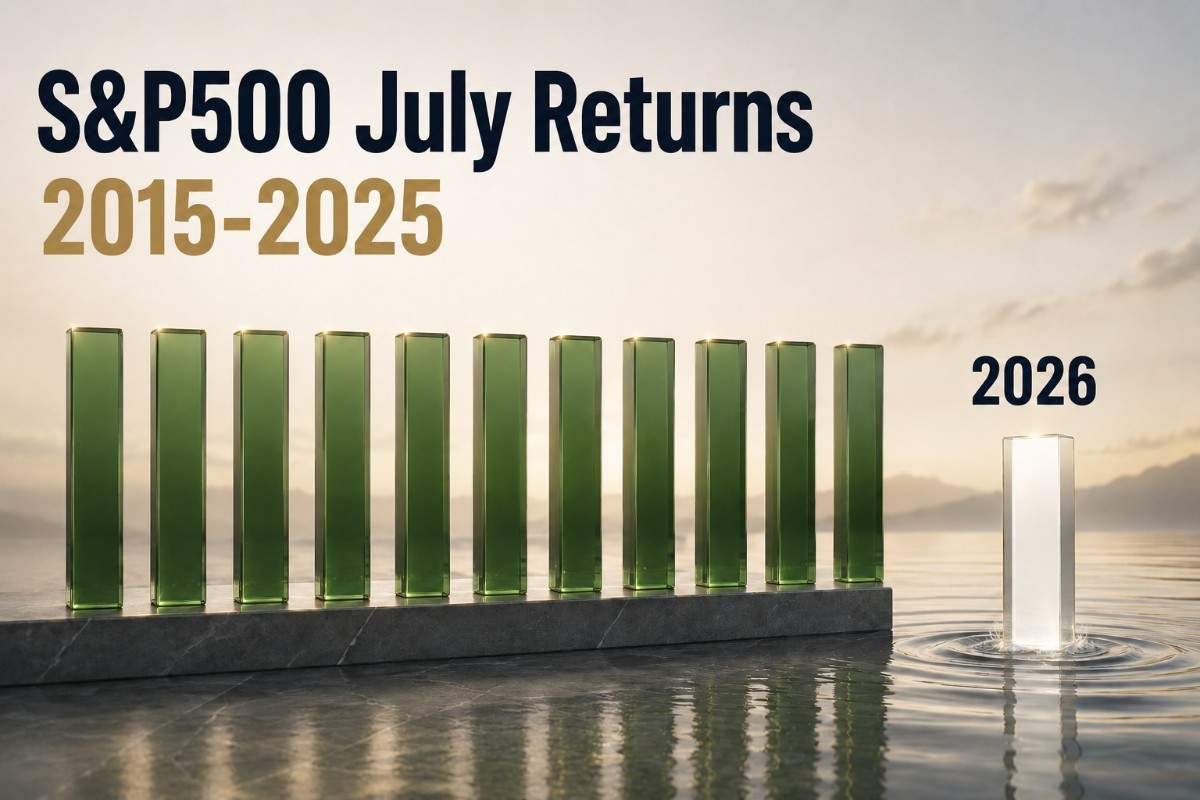
| July | +1.28% |
| August | +0.16% |
| September | −0.84% |
| October | +1.24% |
| November | +2.08% |
| December | +1.16% |

November often benefits from cleaner visibility into year-end earnings outcomes and forward guidance. Portfolio managers also tend to reposition for year-end measurement, which can reinforce risk appetite when volatility is contained.
When positioning is light and volatility eases, incremental buying can become self-reinforcing.
April sits inside a high-information window when earnings updates and guidance resets can support confidence in forward expectations.
Risk budgets are typically fresher, and investors often have more conviction in the earnings path than later in the year. That combination has historically supported steadier demand for equities.
December often reflects year-end positioning and seasonal optimism, which can support prices.
However, the month is not uniform, since late December can see thinner liquidity and sharper moves on smaller flows. Investors should treat “strong on average” as different from “stable in every year.”
September has been the weakest month in the modern dataset, and the longer-term record also shows a bias toward negative outcomes. The pattern is consistent enough to treat as a recurring risk window rather than an anomaly.
The common thread is a post-summer reset in positioning and risk-taking.
Key drivers include:
Rebalancing And Clean-Up Trades: Institutions often realign exposures after summer, which can concentrate selling pressure.
Positioning Resets: Investors return with refreshed limits and less tolerance for crowded trades or stretched valuations.
Macro Calendar Density: Policy, budget, and earnings confirmation often intensify, shifting markets from narrative to verification.
September is also a reminder that seasonality is often about liquidity. When liquidity is thinner, and investors de-risk, correlations rise, and drawdowns become easier to trigger.
August is not the worst month by average return, but it is historically soft and often defined by liquidity constraints. The key risk is not the average result, but the market’s tendency to gap on shocks when participation is thinner.
In years with elevated geopolitical or policy uncertainty, August can behave like a volatility trap.
Long-term averages provide context, but shorter samples can produce different rankings. A period dominated by large policy shifts, concentrated technology leadership, or unusually sharp selloffs can distort what looks “typical.” That is why seasonality should be paired with regime awareness.
The practical approach is comparative:
Structural Seasonality: Longer histories to understand recurring risk windows.
Regime Seasonality: Recent histories to see what the market has rewarded lately.
If the two disagree, investors should assume the current regime has a stronger pull in the short run. Structural seasonality still matters, but mostly as a warning label for historically fragile periods.
“Sell in May and go away” persists because the market has often performed better from November through April than from May through October. That edge exists directionally, but it has weakened at times, especially in policy-dominated cycles or strong secular uptrends.
As a result, rigid calendar trading can underperform after costs and whipsaws.
In 2026, macro shocks can overwhelm seasonal tendencies in either direction. Inflation surprises or energy spikes can damage “strong months,” while easing liquidity can lift “weak months.” Seasonality is most useful here as a risk-budgeting tool, not as an automatic on-off switch.
Seasonality shapes the backdrop, but the S&P 500 ultimately follows a tighter set of drivers. Key drivers include:
Earnings and Forward Margins: Surprise changes in profitability often move both earnings expectations and multiples.
Rates and Real Yields: Shifts in the discount rate can quickly reprice equities, especially growth-heavy exposures.
Inflation and Policy Reaction: Markets trade the expected policy path, not just the inflation print.
Liquidity And Positioning: Systematic flows and hedging can dominate day-to-day moves.
Geopolitics And Energy: Shock-driven repricing can overwhelm seasonality, particularly when risk premiums rise.
Seasonality matters most when these drivers are stable. When they are unstable, seasonality becomes a secondary influence.
September’s weakness does not mean investors should sell every September. It means risk controls often deserve more attention heading into late summer, especially when valuations are stretched and volatility is low. The goal is to reduce fragility, not to trade a rule.
Seasonality works best when it aligns with earnings momentum and the rates backdrop. Late-year strength tends to be more reliable when earnings revisions are improving and policy uncertainty is easing.
If fundamentals conflict with the calendar, fundamentals should carry more weight.
Before leaning into a “strong month,” check the market’s internal signals:
Are earnings revisions rising or falling?
Are yields trending higher or stabilizing?
Is volatility compressing or expanding?
Is positioning crowded or under-owned?
If several answers contradict the seasonal tendency, treat seasonality as background, not a trigger.
Seasonality can help structure entry timing for long-term allocations. If late summer has historically produced better entry points, disciplined investors can plan incremental deployment into weakness rather than chasing peak optimism.
The edge comes from behavior and process, not from prediction.
November has been the strongest month on average since 1980, with April also consistently strong. These months often align with supportive flows and clearer earnings visibility.
September has historically been the weakest month, including in modern datasets and longer histories. Post-summer rebalancing and thinner liquidity often increase drawdown risk.
It is a persistent tendency across decades, but it is not guaranteed in any single year. Treat it as a higher-risk window, not a trading rule.
November–April has often outperformed May-October, but the edge varies by regime. It is more useful for risk budgeting than for automatic selling.
Year-end positioning, improved earnings visibility, and seasonal risk appetite can support late-year strength. Thin liquidity late in December can also amplify volatility.
Use it to plan sizing and timing, not to replace fundamentals. Seasonality helps identify historically fragile periods and potential entry windows.
Understanding how the S&P 500 changes by season is best done as a probability map, not a calendar-based forecast. In the modern era, November has been the strongest on average, while September has been the weakest, and the longer history broadly supports that asymmetry.
In 2026, macro shocks and policy expectations can still overpower seasonal tendencies, so the real value of seasonality is sharper risk management and more disciplined timing.
Disclaimer: This material is for general information purposes only and is not intended as (and should not be considered to be) financial, investment or other advice on which reliance should be placed. No opinion given in the material constitutes a recommendation by EBC or the author that any particular investment, security, transaction or investment strategy is suitable for any specific person.