Published on: 2025-03-03
Updated on: 2026-08-04
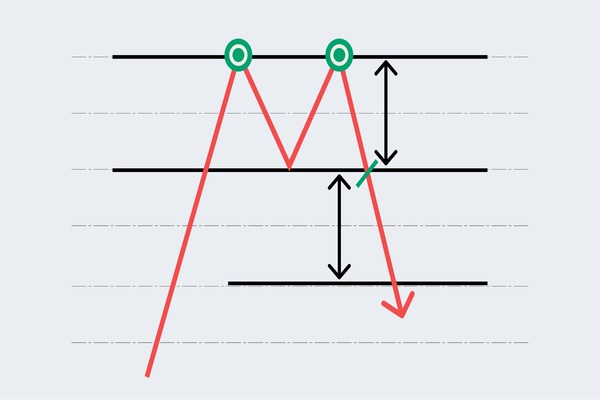
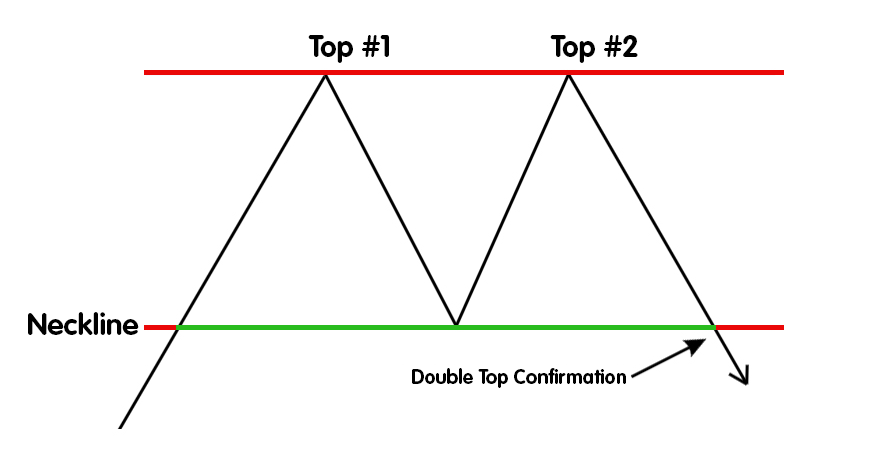
A double top is a bearish reversal pattern. Price rallies to a high, pulls back, rallies a second time to roughly the same high, then fails. The two peaks form an “M” shape. The pattern completes only when price closes below the low between them, a level called the neckline.
Before that close, the shape is a range with two rejections at the same resistance level, meaning a price where selling has repeatedly overcome buying. Most losing trades on this pattern come from acting at the second peak rather than the neckline break.
The prior uptrend. A reversal pattern needs a trend to reverse. The same shape inside a sideways range is only a range boundary.
The first peak. Price sets a new high, buyers stop, price turns down. This fixes the resistance level.
The trough. Price falls back and finds buyers. Its low becomes the neckline.
The second peak. Price rallies again to roughly the same high and fails. That failure is the information: buyers had a second attempt and could not clear it.
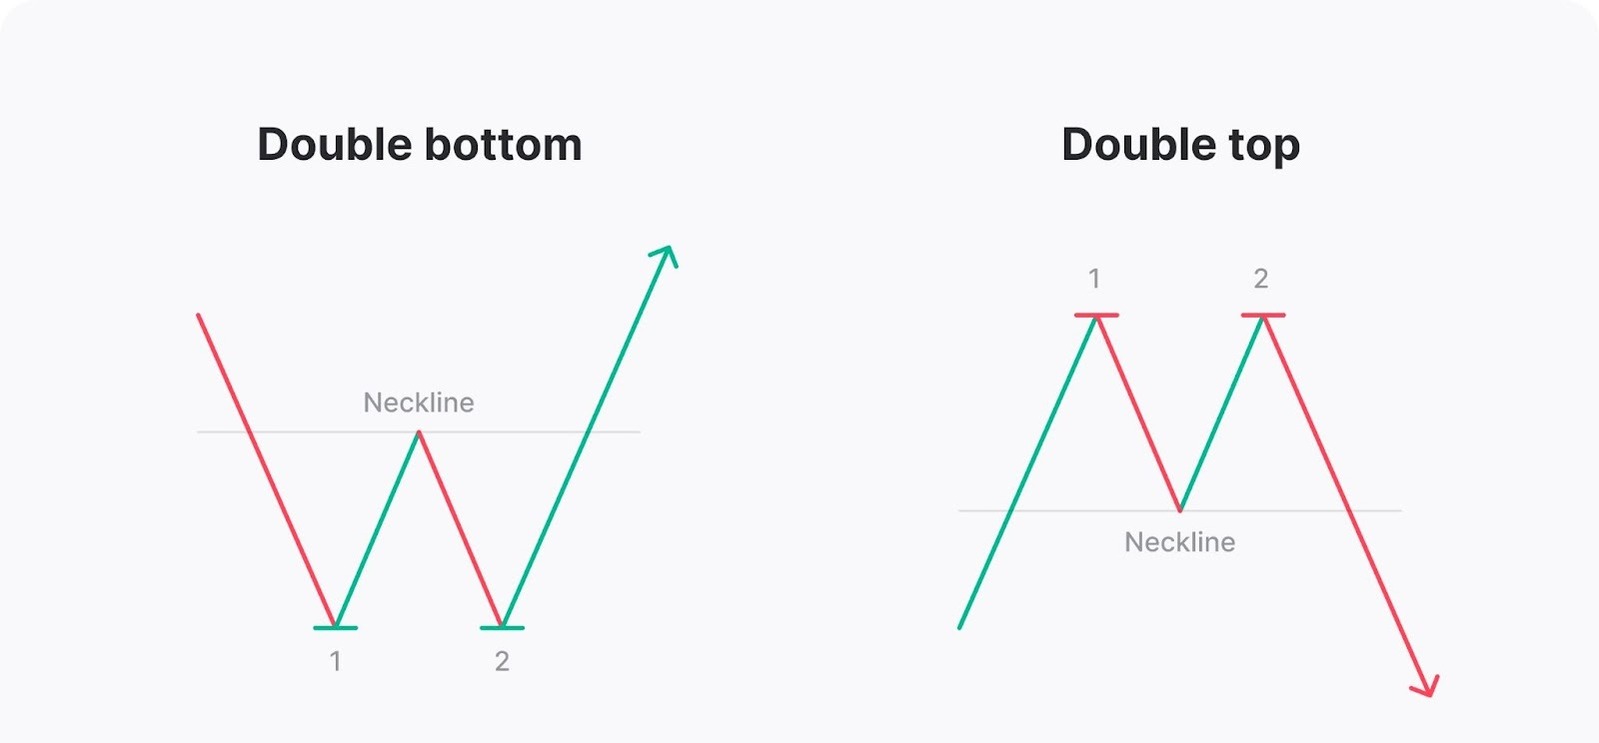
Traders call this shape the M pattern, and its mirror image, the double bottom, the W pattern.
A double top is bearish, but only after confirmation. Two touches of resistance show that sellers are active there, not that the trend has turned. Uptrends frequently pause at a level twice, absorb the supply, then continue higher on the third attempt.
The bearish signal appears on the close below the neckline. At that point, the market has produced a failed high and a lower low, the basic structure of a downtrend.
Chart patterns fail most often at the identification stage, because the shape is subjective. These five checks make it objective.
| Check | What to look for |
|---|---|
| Peak symmetry | Both peaks within roughly 1.5% of their average |
| Time between peaks | Daily-chart research used a 22 trading day minimum |
| Prior trend | A defined uptrend into the first peak |
| Neckline break | A candle close below the neckline, not a wick |
| Volume | Lower on the second peak, expanding on the break |
Volume is the most useful of these filters, and the most often skipped. The guide to reading volume alongside price covers it.
The conventional approach has three parts. Entry comes after a candle closes below the neckline, or on a retest of it from below. The stop goes above the second peak, since a close back above invalidates the pattern. The target is the distance from the peaks down to the neckline, projected the same distance below.
Work through the arithmetic first. Say a stock peaks at $52.00, pulls back to $48.00, then peaks again at $51.70. The peaks sit within 0.6% of their average, so the level is clean. Price then closes below the neckline at $47.90.
Pattern height: $52.00 minus $48.00, so $4.00
Measured target: $48.00 minus $4.00, so $44.00
Entry $47.90, stop $52.30
Risk $4.40, potential reward to target $3.90
That is a reward-to-risk ratio below 1:1. The pattern is textbook and the arithmetic is still poor, because the stop sits above a peak nearly as far from entry as the target. Wide double tops with shallow depth often produce this result. Running the numbers separates a tradeable pattern from a well-drawn one.
Most articles on this pattern quote a success rate with no source. The strongest evidence comes from the Lo, Mamaysky and Wang study of US stocks from 1962 to 1996, using the algorithmic definition above.
The pattern is common. Double tops appeared 2,076 times in the NYSE and AMEX sample, more than any of the other nine patterns tested, including head and shoulders at 1,611.
The pattern carries information. Returns following a double top differed from the general distribution of returns at a statistically significant level. Double bottoms, tested the same way over the same stocks, did not.
Random data still produces the shape. The same algorithm run over simulated random-walk prices returned 535 double tops: far fewer than in real data, and still a large number. A shape appearing that often in randomness is a reason to require confirmation rather than trade the outline.
Four causes account for most failures.
No prior trend. The pattern forms at the top of a range, so there is nothing to reverse.
A wick without a close. Price dips below the neckline intraday, triggers entries, then closes back above. Waiting for the session close removes many.
The wrong level. The neckline sits just above a larger support area, placing the measured target inside it. Marking higher-timeframe support and resistance first catches this.
Weak momentum evidence. The second peak arrives on strong volume with no momentum divergence. A divergence on the RSI, where the second peak is higher in price but lower in momentum, supports the setup, and its absence is a reason for caution.
The so-called fake double top is usually one of these four, most often the second.
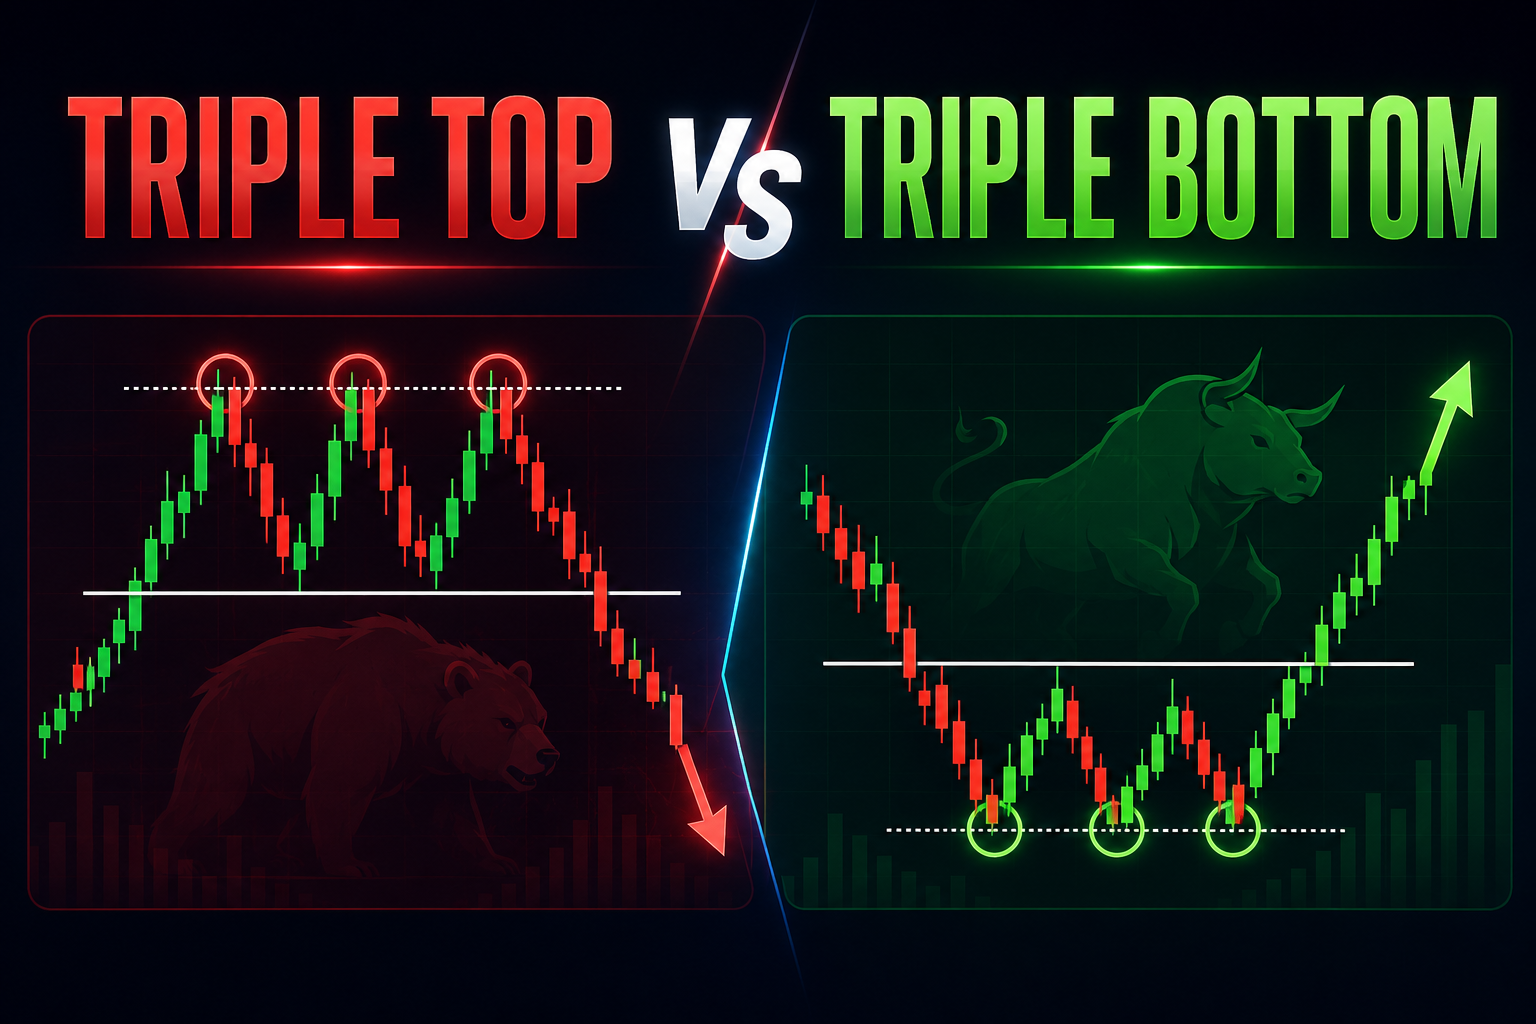
The double bottom is the mirror image, and every rule inverts. In the Lo study it did not reach the same statistical significance as the double top. See the breakdown of double tops against double bottoms, the guide to recurring chart patterns, and the slower rounding top.
No reliable published success rate exists, and figures circulating online are typically unsourced. Peer-reviewed work by Lo, Mamaysky and Wang found that returns after algorithmically detected double tops in US stocks from 1962 to 1996 differed from the general return distribution at a statistically significant level. That indicates information content rather than a win rate.
It depends on the timeframe. Daily-chart research required at least 22 trading days between the peaks; on a 15-minute chart, the same structure forms inside a session.
No. The standard used in academic testing allows each peak to fall within 1.5% of their average, so the second can be slightly higher or lower.
It appears in all of them, because it reflects buyers failing twice at one level. It is applied across share CFDs, currency pairs and index CFDs, though volume analysis is harder in spot forex, where no central exchange volume figure exists.
The double top is worth knowing because it is common, its confirmation rule is unambiguous, and the evidence that it carries information is stronger than for most chart patterns.
The step traders skip is the arithmetic. A textbook pattern can still offer a target smaller than the stop distance needed to hold it. Measure the height, mark the stop, and compare those numbers before the neckline breaks rather than after.
Disclaimer: This material is for general information purposes only and is not intended as (and should not be considered to be) financial, investment or other advice on which reliance should be placed. No opinion given in the material constitutes a recommendation by EBC or the author that any particular investment, security, transaction or investment strategy is suitable for any specific person.