Published on: 2025-06-10
Updated on: 2026-03-18
Support and resistance levels are among the most fundamental concepts in technical analysis. For beginner traders, understanding how to identify these zones and acting on them is essential to building a solid trading strategy.
Fortunately, modern trading platforms offer a variety of support and resistance indicators that simplify this process.
In this 2026 guide, we'll explore the best support and resistance indicator tools for beginners, their function, and how you can use them to identify entry and exit opportunities in real-time markets.

Support is a price level where a falling asset tends to find demand, preventing further decline. Resistance, on the other hand, is a price point where a rising asset faces selling pressure. These levels are not rigid boundaries but areas where price has historically responded.
Understanding these areas helps traders:
Predict potential reversals or breakouts
Plan entry and exit points
Set stop-loss and take-profit orders
Gauge market sentiment
Mastering support and resistance enhances your ability to read charts more effectively, even without additional indicators.
Drawing support and resistance zones by hand can be subjective and prone to mistakes, particularly for beginners in trading. Indicator tools remove guesswork by automatically detecting and plotting these key levels on your charts.
They also help:
Reduce emotional decision-making
Highlight historically crucial price zone
Identify areas of confluence with other indicators like moving averages or Fibonacci retracements
In 2026, most reputable platforms provide user-friendly support and resistance indicators, making them accessible to traders of all skill levels.

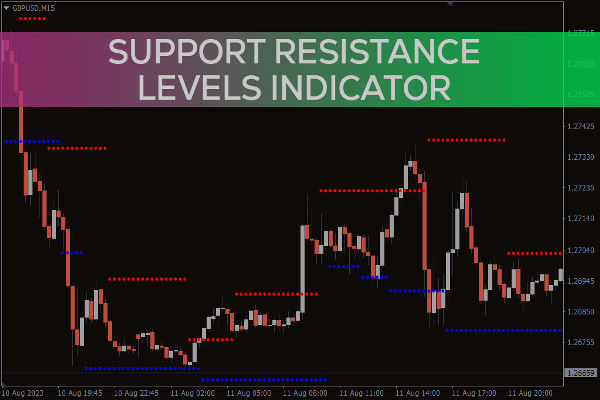
Auto Support and Resistance plots horizontal lines based on historical highs and lows. This tool is ideal for beginners because it works right out of the box and adjusts dynamically as new price action develops.
It also shows how many times a level has been tested, which helps you assess its strength.
Why it's beginner-friendly:
Visual clarity with minimal configuration
Works across all timeframes
The indicator showcases the main pivot point (PP) together with three support levels (S1, S2, S3) and three resistance levels (R1, R2, R3). Numerous traders utilise these levels for short-term trading, particularly in forex and indices.
Pivot levels are determined based on the prior day's high, low, and close, making them perfect for scalpers and day traders.
Benefits for beginners:
Automatic level generation based on live price data
Clear labelling and ease of interpretation
Compatible with demo accounts and backtesting
The Support/Resistance Zones indicator is designed specifically for identifying regions of significant price rejection. It is offered for both MT4 and MT5 and features a user-friendly visual interface that highlights zones instead of lines, indicating that these levels are not precise.
It calculates zones using recent highs and lows and adapts as the market evolves. It also adjusts based on timeframe, ensuring the plotted zones remain relevant for the chart you're analysing.
What makes it suitable for new traders:
Clean and simple layout
Automatically adapts to timeframes
Helps identify fake breakouts by visualising wider zones
While closely related, supply and demand zones are broader than support and resistance as they incorporate volume and price action. However, the concepts often overlap in trading applications.
The tool works by identifying consolidation areas followed by strong price movement—typically a sign of smart money activity. When the price returns to these areas, they act as support or resistance.
Best for beginners wanting to learn advanced price behaviour:
Visually emphasises high-probability reversal areas
Pairs well with candlestick patterns
Encourages strategic thinking rather than mechanical trading
Sometimes, the best "tool" is a blend of manual charting with the help of basic software features. A common practice among beginners is using horizontal ray tools (available on almost every charting platform) combined with candle-based analysis.
Here's how it works:
Identify recent swing highs and lows
Plot horizontal rays to mark potential support and resistance
Watch for price reactions, such as engulfing candles or pin bars, near these zones
While not automated, this method helps beginners learn how support and resistance interact with actual price behaviour, improving their intuition over time. Many traders who start with automated tools eventually adopt a hybrid manual approach like this.
Although not a traditional support and resistance indicator, Fibonacci retracement tools often identify zones where the price may pause or reverse. The key levels—38.2%, 50%, and 61.8%—frequently act as dynamic support or resistance in trending markets.
The tool is built into nearly all charting platforms and is easy to use. You draw the retracement from a significant low to a high (or vice versa), and the software automatically plots the key levels.
Fibonacci retracements work well when they align with previously tested support or resistance zones.
Why it's great for beginners:
Enhances existing analysis
Provides additional confirmation for trades
Encourages structured entries and exits

While slightly more advanced, order block indicators are gaining popularity even among newer traders. These tools identify areas on the chart where institutions or large traders have left a footprint—essentially refined support and resistance zones based on volume and price imbalance.
In 2026, this support and resistance indicator offer beginner-friendly order block indicators with color-coded zones and price tags. They automatically detect consolidation before major moves, helping traders time entries more accurately.
If you're already comfortable with basic support and resistance concepts, experimenting with order blocks can take your strategy to the next level.
Choosing the right indicator is only half the journey. The next step is to integrate these tools into a strategy.
Here's a sample flow:
Use a support/resistance tool (e.g., Auto SR or Pivot Points) to map the chart
Wait for the price to approach a level
Look for confirmation through candlestick patterns or momentum indicators (e.g., rsi divergence)
Enter trade with stop-loss below/above the level and target the next support/resistance
It's important not to rely on indicators in isolation. Instead, treat them as tools that support your decision-making alongside price action, risk management, and news analysis.
The "Auto Support and Resistance" indicator is highly recommended for beginners because it works immediately, plotting horizontal lines based on historical highs and lows and adjusting dynamically as new price action develops.
The "Supply and Demand Zones" indicator is excellent for identifying areas where smart money activity likely occurred (consolidation followed by strong expansion).
The "Support/Resistance Zones" indicator (available on MT4/MT5) is ideal for this. It highlights broader, shaded areas where price has historically reversed, rather than precise, rigid lines.
In conclusion, support and resistance are the cornerstones of technical trading, and thanks to modern tools, beginners can now identify and act on them with greater confidence.
Whether you prefer automated indicators such as Pivot Points and Auto SR or advanced tools like order blocks and supply zones, the key is choosing a tool that suits you. Start with the basics, practice on a demo account, and gradually layer on complexity as you gain experience.
Disclaimer: This material is for general information purposes only and is not intended as (and should not be considered to be) financial, investment or other advice on which reliance should be placed. No opinion given in the material constitutes a recommendation by EBC or the author that any particular investment, security, transaction or investment strategy is suitable for any specific person.