Published on: 2025-07-30
Updated on: 2025-07-30
When an established uptrend weakens, traders look for early signs of reversal. One of the most reliable signals is the Rounding Top Pattern.
Also known as an inverted saucer or reverse U-pattern, the rounding top is a classic bearish chart formation signalling the end of bullish momentum. Seen across stocks, forex, commodities, and crypto, it helps traders anticipate trend reversals before major declines unfold.
In this detailed guide, we'll unpack what the pattern means, how to identify it, strategies for trading it, and risk-aware best practices.

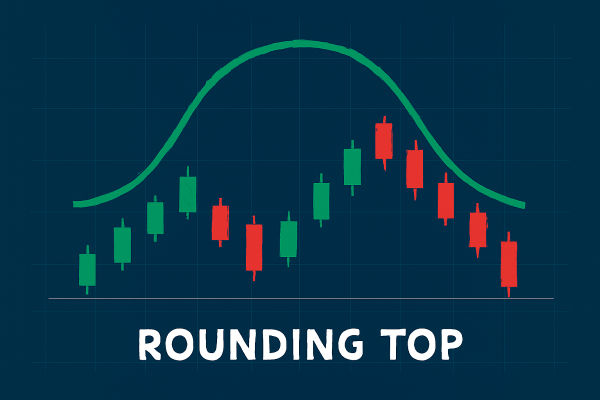
A rounding top pattern forms after a prolonged uptrend, as buying momentum gradually falters. Instead of a sharp peak, price action arcs gently into a dome-shaped curve, resembling an upside-down bowl.
This smooth transition reflects weakening demand and growing caution among buyers, ultimately setting the stage for a bearish shift when price breaks below the base or "neckline" of the formation.
Unlike abrupt reversal formations like double tops patterns, rounding tops unfold slowly, often over weeks or even months, reflecting gradual changes in market psychology. The pattern is completed when price decisively closes below the neckline, confirming bearish potential.

First, spot an established uptrend marked by higher highs and higher lows. Next, observe the peak flatten and form a curved arc, with progressively subdued highs and shallow pullbacks.
Volume should taper during the ascent and decline as momentum fades, then often spike when breakdown occurs. Key levels include the highest point of the arc (peak resistance) and the lowest base points (neckline).
Look for symmetry in the curve, a hallmark of a clear rounding top. If volume remains high during the decline or if pattern formation accelerates, traders should treat the structure with caution, as it may not reflect a genuine rounded reversal.

Confirmation and Entry
Patience is vital: you should wait for a clear breakout below the neckline, ideally on high volume. Upon confirmation, entering a short or reducing the long exposure is appropriate.
Stop Placement
A stop-loss typically sits just above the peak or the highest point of the dome. This location helps protect against false signals, but must be balanced against risk-reward considerations.
Profit Targeting
Measure the vertical distance from peak to neckline and project that same distance downward from the breakout point to estimate a conservative profit target. It provides traders a rational exit determined by pattern formation.
Timing Entries
If a retest of the broken neckline occurs, traders may choose to enter on failed bounce behaviour, such as bearish rejection candles or volume spikes confirming failure to reclaim support.
Rounding tops appear across commodities, forex pairs, and cryptocurrencies. They're best studied on daily, weekly, or 4-hour charts. Higher timeframes reduce noise and improve pattern clarity.
Short-term charts may display the shape, but the underlying behaviour may not hold around low-volume intraday swings.
For context, volume is a powerful ally in rounding top analysis. A taper during the arc formation indicates waning bullish conviction. A surge in volume as price breaks the neckline reinforces the bearish reversal signal. Without clear volume confirmation, pattern reliability diminishes, traders risk false breakdown or resumed bullish pressure.
Complementary signals like RSI bearish divergence or moving average crossovers (e.g., short-term MA falling below long-term MA) further strengthen setup validity when used alongside price structure observation.
Advantages:
It's simple to spot, offers a defined entry/exit structure, and provides objective targets once confirmed. The pattern is versatile across instruments.
Limitations:
It forms slowly and can lead to impatience. False breakdowns are possible if volume is unreliable. Market context matters as patterns in choppy ranges or consolidation environments may underperform.
Answer:
A rounding top pattern signals a potential bearish reversal after a prolonged uptrend. It suggests that buying momentum is weakening and sellers may soon take control, leading to a possible downtrend once the price breaks below key support.
Answer:
Yes, it can be reliable, especially when confirmed by volume and other indicators such as RSI divergence or moving average crossovers. However, false breakouts can occur, so it's crucial to wait for confirmation before acting.
Answer:
The most common strategy is to enter a short position once the price breaks below the neckline with strong volume. A stop-loss is usually placed above the peak, and the profit target is estimated based on the height of the pattern projected downward.
In conclusion, the rounding top pattern is notable as one of the most readable and actionable bearish reversal signals in technical analysis. By understanding its formation, volume dynamics, confirmation criteria, and trade mechanics, traders can use it to spot trend exhaustion and position accordingly.
Whether trading equities, forex, crypto, or commodities, watching for rounding top formations can help you anticipate reversals before they unfold, and that insight is invaluable in navigating volatile markets.
Disclaimer: This material is for general information purposes only and is not intended as (and should not be considered to be) financial, investment or other advice on which reliance should be placed. No opinion given in the material constitutes a recommendation by EBC or the author that any particular investment, security, transaction or investment strategy is suitable for any specific person.