Published on: 2025-06-20
In technical analysis, Chart Patterns serve as visual cues for traders to anticipate future price action. Among these patterns, the Adam and Eve formation stands out for its unique double-bottom or double-top structure and its predictive reliability.
Resembling a combination of sharp and rounded troughs or peaks, the Adam and Eve pattern is often used to spot market reversals at key price levels.
In this comprehensive guide, we will break down the Adam and Eve pattern, explain how to trade it effectively and provide examples that demonstrate how traders utilise it.

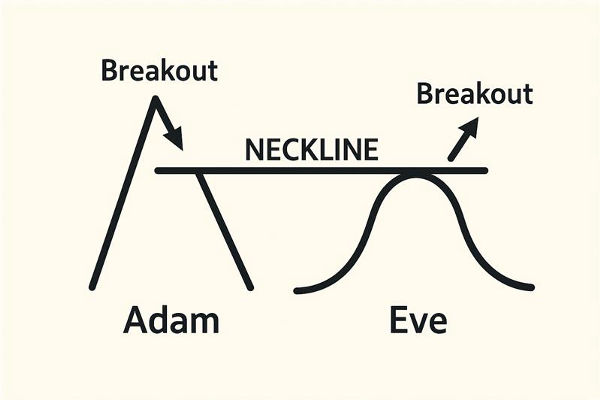
The Adam and Eve pattern is a two-part reversal formation that appears either as a double top or a double bottom. Its structure combines two distinct types of peaks or troughs:
Adam: A sharp, narrow V-shaped peak (or bottom)
Eve: A rounder, wider U-shaped peak (or bottom)
When combined, these shapes provide a powerful signal that a trend may be ending and a reversal is likely to follow. The pattern is more commonly found at market bottoms (double bottom), indicating bullish reversals. However, it can also appear at tops, signalling bearish reversals.
The formation of an Adam and Eve pattern typically unfolds in a few stages:
Downtrend or Uptrend Preceding the Pattern: Typically, there is a significant trend leading into the pattern. A downtrend indicates a double bottom, while an uptrend signifies a double top.
Adam Formation: The first bottom (or top) is a steep and sharp move, forming a quick reversal. The price bounces back quickly after this formation.
Eve Formation: After a short rebound, the price revisits the same area but forms a more rounded, slower-moving bottom (or top). It reflects hesitation or a softer test of support or resistance.
Breakout Point: Once the Eve part is completed, the price breaks through the neckline — a horizontal resistance or support line. A breakout usually occurs alongside an increase in trading volume.
Confirmation and Entry: The breakout past the neckline confirms the pattern. Traders often enter after this confirmation to ride the reversal move.

The key to identifying an Adam and Eve pattern is recognising the price structure. Look for two adjacent peaks or troughs with different shapes:
Adam is narrow, steep, and fast-forming
Eve is wider, more gradual, and often accompanied by more volume.
Use the following tools to assist in identification:
Trendlines to mark the neckline
Volume indicators to confirm increasing activity on breakout
Candlestick analysis to validate pattern structure
Support/resistance levels for context and confluence
While the pattern can appear on any timeframe, it's most reliable on the 1H, 4H, and daily charts.

The Adam and Eve Bottom appears after a downtrend and signals a potential bullish reversal. It consists of a sharp drop followed by a sharp bounce (Adam), then a more rounded dip and gradual rise (Eve).
The neckline, in this case, is the horizontal resistance formed by the highs between the two bottoms. Once the price breaks above this resistance, it confirms a bullish breakout.
Traders interpret this as a sign that the sellers have lost control, and buyers are stepping in with greater conviction.
Trading Strategy for Adam and Eve Bottom
After identifying the Adam and Eve bottom, traders typically:
Wait for the price to break and close above the neckline
Enter a long position on confirmation
Set a stop-loss just below the Eve's bottom
Target a profit equal to the height between the Eve bottom and the neckline
It creates a favourable risk-reward setup in trending or recovering markets.
Real-World Example
In late 2022, Bitcoin established a textbook Adam and Eve bottom around the $16,000 level. After a sharp price drop (the Adam), BTC experienced a strong rebound, followed by a gradual decline that formed a rounded bottom (the Eve). This double-bottom structure found support in the same area.
When the price broke above the neckline at around $18,000, accompanied by increased volume, it signalled a bullish breakout. The market continued to rise, confirming the pattern.
The Adam and Eve Top is the inverse of the bottom pattern. It appears after an uptrend and indicates a potential bearish reversal.
The Adam top forms a sharp spike in price, followed by a retracement. The Eve top follows, forming a more rounded peak. Once the price breaks below the neckline (drawn through the low between the two peaks), the bearish reversal is confirmed.
Trading Strategy for Adam and Eve Top
In this case, traders will:
Watch for a break and close below the neckline
Enter a short position upon confirmation
Set a stop-loss just above the Eve peak
Aim for a target equivalent to the distance between the Adam top and the neckline
This bearish setup is useful for capitalising on market reversals in overheated conditions.
Real-World Example
In early 2023, Apple's stock price peaked near $175, forming a sharp spike (Adam), followed by a retracement to $170. Then it slowly climbed back up to $175 again, this time becoming a rounded top (Eve).
The neckline was drawn at $170. When the price broke below it, AAPL declined to $160, confirming the bearish setup.
This scenario showcases how, even in strong uptrends, the Adam and Eve Top can signal short-term reversals and profit-taking opportunities.
Use other indicators (volume, RSI, moving averages) to validate setups.
Draw neckline levels precisely using candle bodies, not just wicks.
Be patient—allow the Eve portion to fully form before acting.
Manage risk with tight but logical stop-losses below or above the Eve peak and trough.
Practice on historical charts and backtest the pattern in different markets.
Professional traders understand that no single pattern guarantees profits. The Adam and Eve setup should be one part of a larger Trading plan.
In conclusion, the Adam and Eve pattern is one of the more reliable reversal formations in technical analysis, thanks to its clear shape, built-in confirmation signal, and psychological foundation.
To trade it successfully, learn to distinguish the V and U shapes, wait for neckline confirmation, and always apply sound risk management. Over time, you'll find this pattern to be a valuable addition to your trading toolkit.
Disclaimer: This material is for general information purposes only and is not intended as (and should not be considered to be) financial, investment or other advice on which reliance should be placed. No opinion given in the material constitutes a recommendation by EBC or the author that any particular investment, security, transaction or investment strategy is suitable for any specific person.