Published on: 2026-07-15
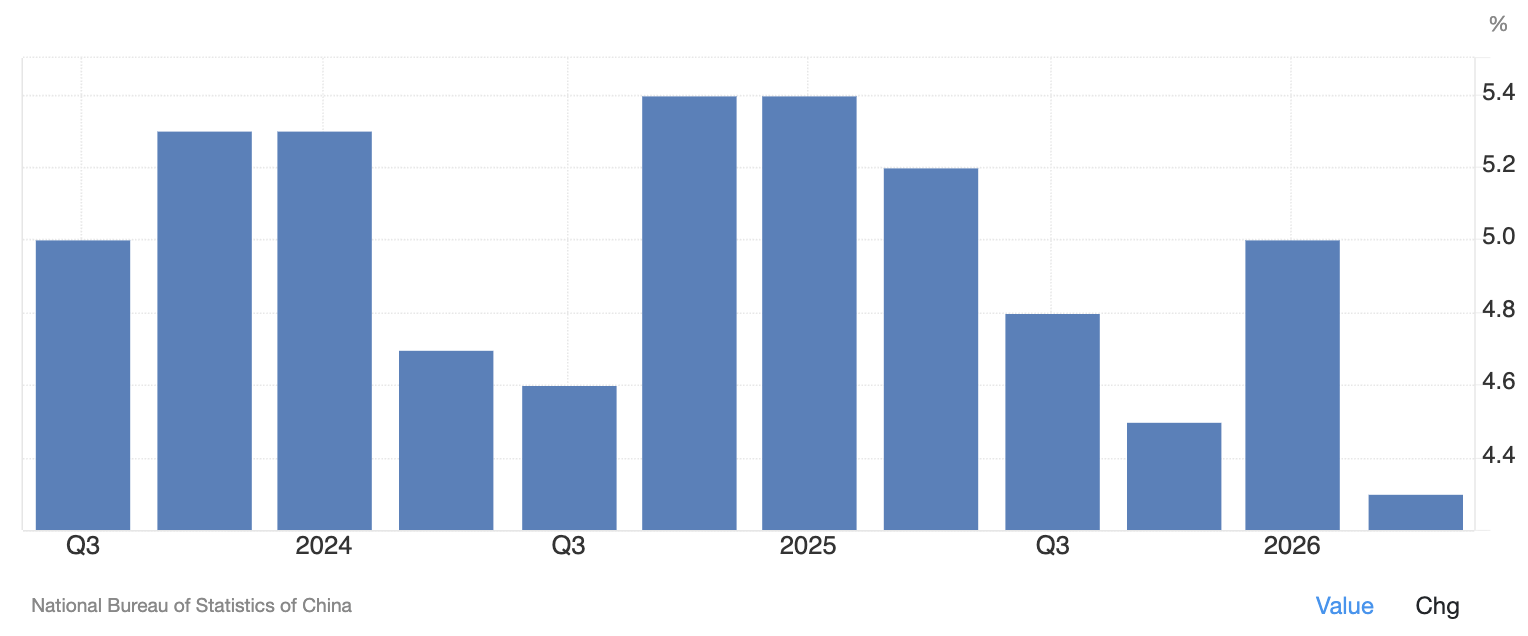
China’s economy grew 4.3% year-on-year in Q2 2026, missing the 4.5% consensus and slowing sharply from 5.0% in Q1. It was the weakest quarter since late 2022. The intuitive market reaction, a weaker yuan, never came USD/CNH traded. in a tight range around 6.77 through the 15 July session and showed little of the depreciation a growth miss would normally bring.

Traders appear to have weighed it against forces pulling the other way: firmer June activity data, a strong People’s Bank of China (PBOC) fixing below the watched 6.80 level, and a large trade surplus underpinning the currency. The disappointment was real but small, and a Q2 slowdown had been widely flagged in advance.
Q2 GDP of 4.3% missed the 4.5% forecast and was the slowest pace in over three years, but the surprise was only 0.2 percentage point.
First-half growth of 4.7% kept China inside its full-year target range of 4.5% to 5.0%, so the annual target has not been missed, though the Q2 quarter itself printed at the low end of that band.
The economy is running on two tracks: exports and high-tech manufacturing are strong, while investment and domestic demand are weak. Fixed-asset investment fell 5.7% in H1, worse than expected.
USD/CNH showed little immediate reaction because the miss was modest and largely expected, activity data was firmer, the PBOC set a firm fix, and a large trade surplus supported the yuan.
Direction from here likely hinges on domestic demand, policy support, the PBOC’s fixing path, and the dollar, which is caught between an oil-driven inflation impulse and Fed rate expectations.
China's GDP growth rate rose 4.3% year-on-year in the April to June quarter, below the 4.5% consensus and down from 5.0% in Q1. It was the slowest annual pace since Q4 2022. On a quarterly basis, growth was 0.9%, in line with forecasts but softer than the prior quarter’s 1.3%. First-half growth came in at 4.7%.
The detail matters more than the headline, because the components diverged sharply:
| Indicator | Latest result | Comparison | Read |
|---|---|---|---|
| Q2 GDP, year-on-year | 4.3% | 4.5% forecast | Modest downside miss, slowest since 2022 |
| Q2 GDP, quarter-on-quarter | 0.9% | 0.9% forecast | In line |
| June industrial production | 5.3% | 4.5% in May | Accelerated, beat |
| June retail sales | 1.0% | -0.6% in May | Rebounded to growth |
| H1 fixed-asset investment | -5.7% | -4.9% expected | Weaker than expected |
| H1 real-estate investment | -18.0% | n/a | Deep, ongoing drag |
Industrial production accelerated and high-tech manufacturing output expanded by 13.3% in the first half. Retail sales returned to growth after May’s first decline since 2022. The soft spot was investment: the 5.7% H1 drop was led by an 18% collapse in real-estate development, with infrastructure investment down 2.4% and manufacturing investment down 1.2%. This is slower, uneven growth, not a broad contraction.
A 4.3% expansion is still growth, not recession. The concern is momentum and composition.
Much of the headline appears to have been supported by external demand: exports rose about 27% year-on-year in June in US-dollar terms (roughly 21% in yuan terms), and the monthly large trade surplus widened to about $125bn, among the largest on record, while investment shrank and household consumption stayed subdued.
Imports also jumped around 36%, so net exports are not the whole story, but strong overseas demand was clearly an important buffer. The oil-price spike tied to the Iran conflict has meanwhile helped end a prolonged run of producer-price deflation, even as consumer inflation stayed modestly positive.
That divergence defines the quarter: an advanced-manufacturing and export engine running hot, and a domestic economy, property above all, still stalling. First-half growth of 4.7% sits inside the 2026 target of 4.5% to 5.0%, so the annual goal is intact for now, even though the Q2 quarter alone came in at the low end of it.
Through the 15 July session, USD/CNH traded in a narrow band around 6.77 to 6.78 and stayed close to its opening level rather than selling off. Intraday data put the range at well under 100 pips, roughly 85 to 90 points. A lower USD/CNH means fewer offshore yuan buy one dollar, i.e. a firmer yuan; a higher rate means a stronger dollar.
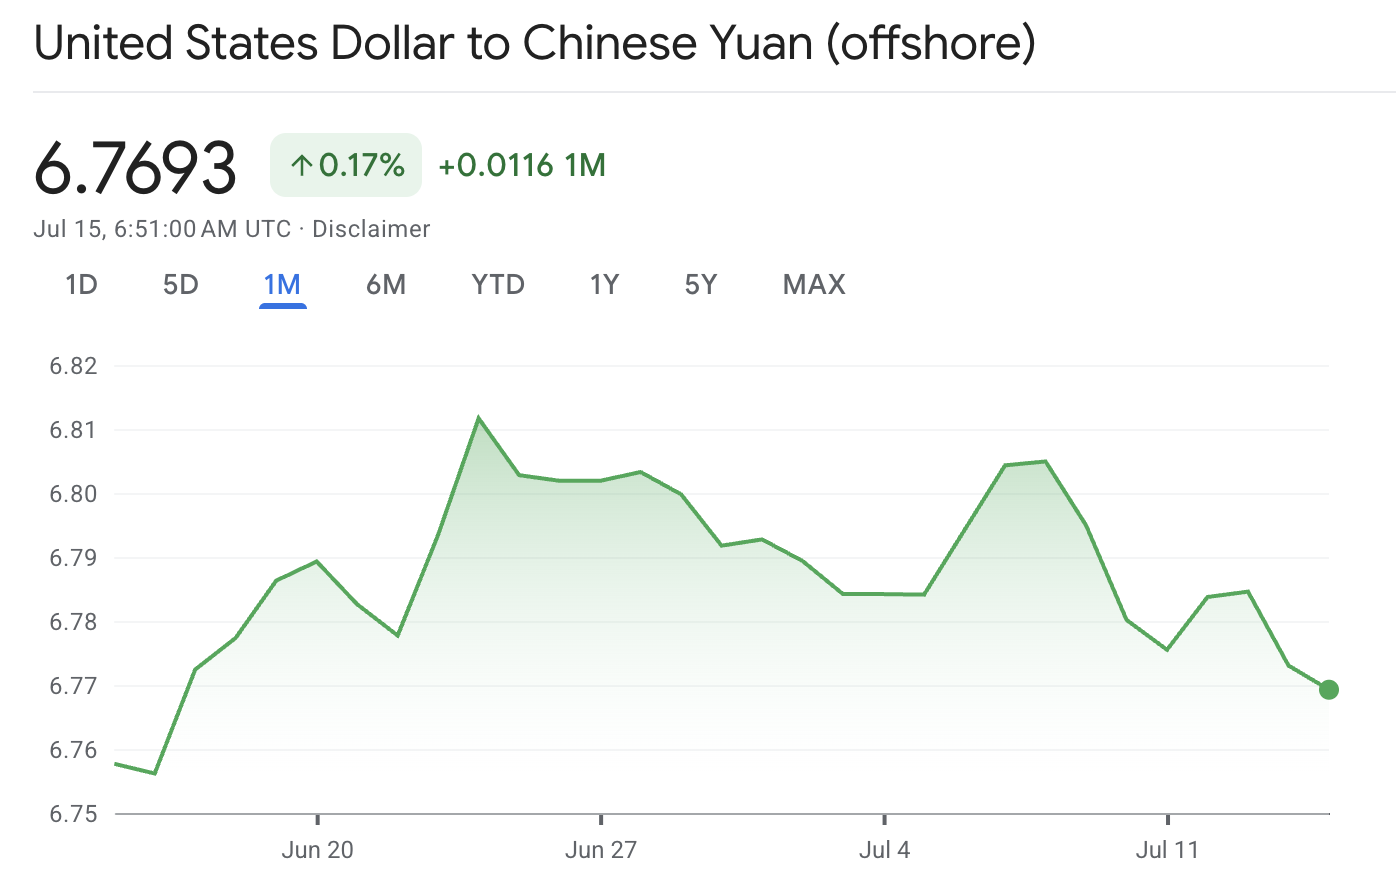
The pair showed little of the depreciation that weaker growth would normally imply. Any net change on the day was fractional, and far too small to describe as a directional move. What it confirms is that the GDP miss did not trigger sustained yuan selling.
Growth undershot consensus by just 0.2 point, and a Q2 slowdown had been flagged for weeks. Currency markets tend to trade the gap between the print and what price already assumes, and much of the disappointment appears to have been discounted beforehand.
Industrial production beat at 5.3% and retail sales swung back to +1.0%. Even with investment weak, the release did not read as a broad deterioration.
The PBOC set a firm reference rate. China runs a managed float, with a daily USD/CNY midpoint (the “fixing”) anchoring onshore trading. The yuan was also supported by a firm PBOC reference rate, with the 15 July fixing set at 6.7910, 80 points stronger than the prior 6.7990 and below the closely watched 6.80 threshold.
Analysts widely read sub-6.80 fixings as a signal the central bank is not trying to restrain the yuan, and prefers to limit rapid depreciation rather than force weakness. Spot was already trading stronger than the fix, so the reference rate broadly confirmed the market’s lean rather than fighting it. The fix cannot override fundamentals, but it can set the pace and signal a preference for orderly conditions.
The export boom and a June surplus of about $125bn generate persistent yuan demand, cushioning the currency against a soft growth headline.
USD/CNH is two currencies, and the dollar leg likely mattered as much as the China data.
The dollar was a key swing factor, since elevated Treasury yields and changing Fed expectations can move USD/CNH even when China's domestic outlook is unchanged.
The broader 2026 backdrop is an oil-driven inflation impulse from the Iran conflict that has kept Fed “higher-for-longer” expectations, and the dollar, relatively firm, which would normally add upward pressure on the pair.
CNH trades offshore while CNY trades onshore, hence the latter is more tightly bound to the fixing and domestic liquidity. In the same intraday snapshots, USD/CNY also sat near 6.77, with no material gap opening between the two.
That suggests offshore markets were not pricing meaningfully more yuan pressure than the onshore market at the time. The signal to watch over coming sessions is the spread: a persistently weaker CNH than CNY would flag offshore caution on the currency.
Domestic demand. Further weakness in fixed investment or a stall in retail sales would raise the odds of additional stimulus.
The PBOC’s fixing path. A run of firm sub-6.80 fixes would keep depreciation contained; softer settings would open room for USD/CNH to rise.
Policy support. Fiscal measures aimed at consumption or infrastructure could lift growth expectations; monetary easing has a more mixed currency effect.
The dollar and the oil shock. US inflation, Treasury yields, Fed expectations, and oil price movements can move USD/CNH even when the China outlook remains unchanged.
A small net move after major data rarely means the data was ignored. More often, several forces act at once and cancel out: a broadly expected result, firmer supporting indicators, central-bank guidance, and offsetting moves in the other currency.
It is also worth watching later sessions, since delayed moves can surface as rate expectations and capital flows adjust well after the first hour.
No. The reaction also depends on the forecast, supporting data, positioning, the PBOC fix, the trade balance, and the dollar.
A weaker CNH relative to CNY suggests offshore markets are pricing more yuan pressure than the onshore market.
Exports and high-tech manufacturing were strong, with June exports up about 27% in US-dollar terms and a large trade surplus helping offset weak investment and consumption.
China’s 4.3% Q2 growth was its slowest in over three years and confirmed fading momentum, but the economy kept expanding and first-half growth stayed within the official target.
USD/CNH showed little immediate reaction because the miss was modest and largely expected, activity data firmed, the PBOC held a strong sub-6.80 fix, and a large trade surplus supported the yuan, with the dollar a key swing factor on the day.
The next move likely depends on whether domestic demand recovers, how Beijing responds, and where the oil shock leaves US inflation and the dollar.