Published on: 2025-04-15
Updated on: 2026-08-10
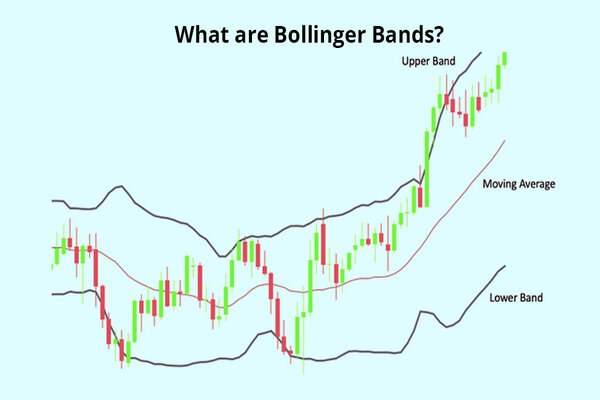
Bollinger Bands are a volatility indicator made of three lines drawn on a price chart. The middle line is a 20-period simple moving average. The upper and lower lines sit two standard deviations above and below that average. Because standard deviation moves with volatility, the outer bands widen when a market becomes active and contract when it goes quiet.
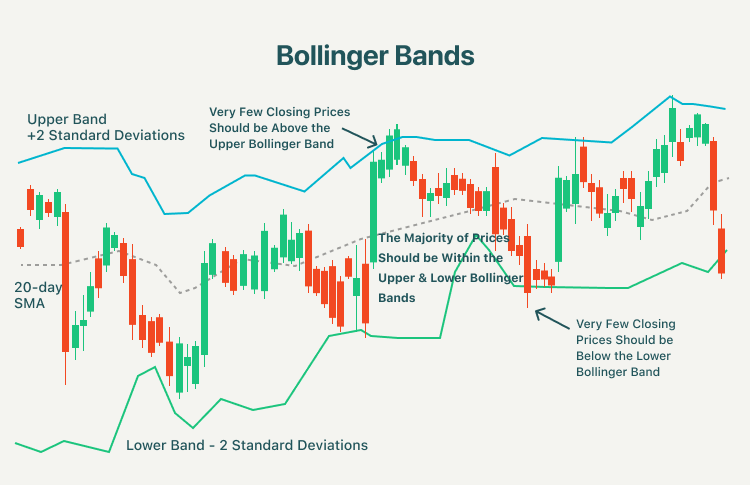
The math is short enough to do by hand.
Middle band = 20-period simple moving average of closing prices
Upper band = middle band + (2 × standard deviation of the same 20 closes)
Lower band = middle band − (2 × standard deviation of the same 20 closes)
Two companion readings come from the same three lines and answer questions the bands alone cannot.
%b shows where price sits inside the channel: (price − lower band) ÷ (upper band − lower band). A reading of 1 means price is at the upper band, 0 means the lower band, and 0.5 means the moving average. Readings above 1 or below 0 mean price has closed outside the channel.
BandWidth measures how wide the channel is: (upper band − lower band) ÷ middle band. It turns the impression of “narrow” or “wide” into a number you can compare against the last six or twelve months.
Two standard deviations would not capture about 95% of observations if price data followed a normal distribution. Returns show fat tails and volatility persistence, so extreme moves happen far more often than a bell curve predicts, a property documented since Benoit Mandelbrot’s 1963 study of speculative prices in the Journal of Business.
Bollinger tackles this in his own published rules. Make no statistical assumptions from the standard deviation calculation, he writes, because the distribution of security prices is non-normal and a 20-observation sample is too small for statistical significance. In practice, roughly 90% of price action falls inside the default bands, not 95%. Price closing outside them is a recurring event rather than a rare one.
The most common misreading is to treat the upper band as a sell trigger and the lower band as a buy trigger. Bollinger’s rules state the opposite: a tag of a band is a tag, not a signal, and closing outside the bands is initially a continuing signal.
In a strong trend, price can walk the upper band for many consecutive sessions, pulling back only to the middle line before pushing higher. Selling the first touch means fading the strongest part of the move. In a sideways market, the bands behave more like dynamic support and resistance, and reversion to the middle line is more frequent.
The indicator cannot tell you which regime you are in. That judgment comes from price structure and from a second, unrelated tool.
Once BandWidth falls to the lowest level of the past six months, the market is in what Bollinger calls the Squeeze. Low volatility tends to be followed by higher volatility, so a squeeze flags that a larger move is building.
It does not flag direction. It also produces a documented trap called the head fake, where price breaks one way out of the squeeze, pulls in the traders watching that break, then reverses.
US equities in 2017 and 2018 show the dynamic clearly. The Cboe Volatility Index closed at 9.14 on November 3, 2017, its lowest close on record, and stayed compressed for months. On February 5, 2018, it closed at 37.32, a one-day rise of about 20 points that the Bank for International Settlements recorded as the largest since 1987. The quiet stretch resolved violently, and nothing in it indicated which way.
Start with 20 periods and 2 standard deviations. In MetaTrader 4 and MetaTrader 5, the tool sits under Insert, then Indicators, then Trend, with defaults of Period 20, Deviations 2, Shift 0, and Applied price set to Close. The middle line is a simple moving average by design, because the standard deviation calculation uses a simple average and the two need to match. EBC’s guide to adding technical indicators in MT4 covers the steps.
If you lengthen or shorten the average, Bollinger’s guidance is to adjust the deviation with it: about 2.1 deviation at 50 periods, and about 1.9 at 10 periods. Avoid tuning the numbers until they fit a chart you have already seen, since settings optimised on past data describe that data rather than predict the next move.
Bollinger’s fourth guideline is a useful filter: confirming indicators should not be directly related to each other. Two momentum oscillators are no better than one, because they measure the same thing and agree by construction.
Bands measure volatility and relative position, so sensible partners measure something else, such as momentum through RSI or participation through volume. MACD adds trend context, though both tools draw on moving averages, so the overlap is real. For a second volatility view, Keltner Channels use average true range instead of standard deviation and react differently to sudden gaps.
The bands are descriptive. Every input is a past price, so they lag turns.
Their edge has also thinned with popularity. Research by Fang, Jacobsen and Qin in the Journal of Portfolio Management (2017) found Bollinger Band rules would have been highly profitable in international equity markets before the technique was widely published, with that predictive power declining after the method became mainstream in 2001. Widely known patterns get traded away.
Bollinger’s own summary is the fair one: the bands do not provide continuous advice; they help identify setups in which conditions may favour a plan you already have.
They show whether price is high or low relative to recent volatility, and whether volatility itself is expanding or contracting. Width is the volatility reading; position within the channel is the relative price reading.
The 20-period average with 2 standard deviations is the published default and the setting most platforms adopt. Shorter averages respond faster and produce more band tags; longer averages produce fewer and need a wider deviation to keep containment steady.
They answer different questions. RSI measures momentum on a fixed 0 to 100 scale, while Bollinger Bands measure volatility and relative price position. Because they are unrelated, they work well as a pair.
The calculation is identical on any instrument with a price series. What changes is typical width, so compare each market against its own BandWidth history rather than against another market.
Bollinger Bands earn their place on a chart by turning price variability into something visible and measurable, through band width, BandWidth and %b. They are weakest when treated as a signal generator and strongest as context for a decision made on other grounds, which is how their creator frames them.
The practical step for most traders is to stop watching for band touches and start tracking BandWidth against its own six-month range, because knowing whether a market is unusually quiet or unusually active changes how much room a position needs far more than any single touch of a line.
Disclaimer: This material is for general information purposes only and is not intended as (and should not be considered to be) financial, investment or other advice on which reliance should be placed. No opinion given in the material constitutes a recommendation by EBC or the author that any particular investment, security, transaction or investment strategy is suitable for any specific person.