Published on: 2026-09-14
Updated on: 2026-09-14
WTI crude broke into triple digits last week, surging more than 9%. As direct clashes and retaliatory tanker seizures between the US and Iran in the Persian Gulf continue to escalate, commercial shipping through the Strait of Hormuz has effectively ground to a halt, rendering the Trump administration's economic sanctions seemingly ineffective.
Yemen's Houthi rebels have made significant advances, seizing control of the gateway to the Red Sea and launching attacks on energy facilities across multiple Saudi cities, leaving another vital shipping lane in danger of being cut off. Meanwhile, Saudi Arabia has shut down a major oil pipeline following a drone attack from Iraq.
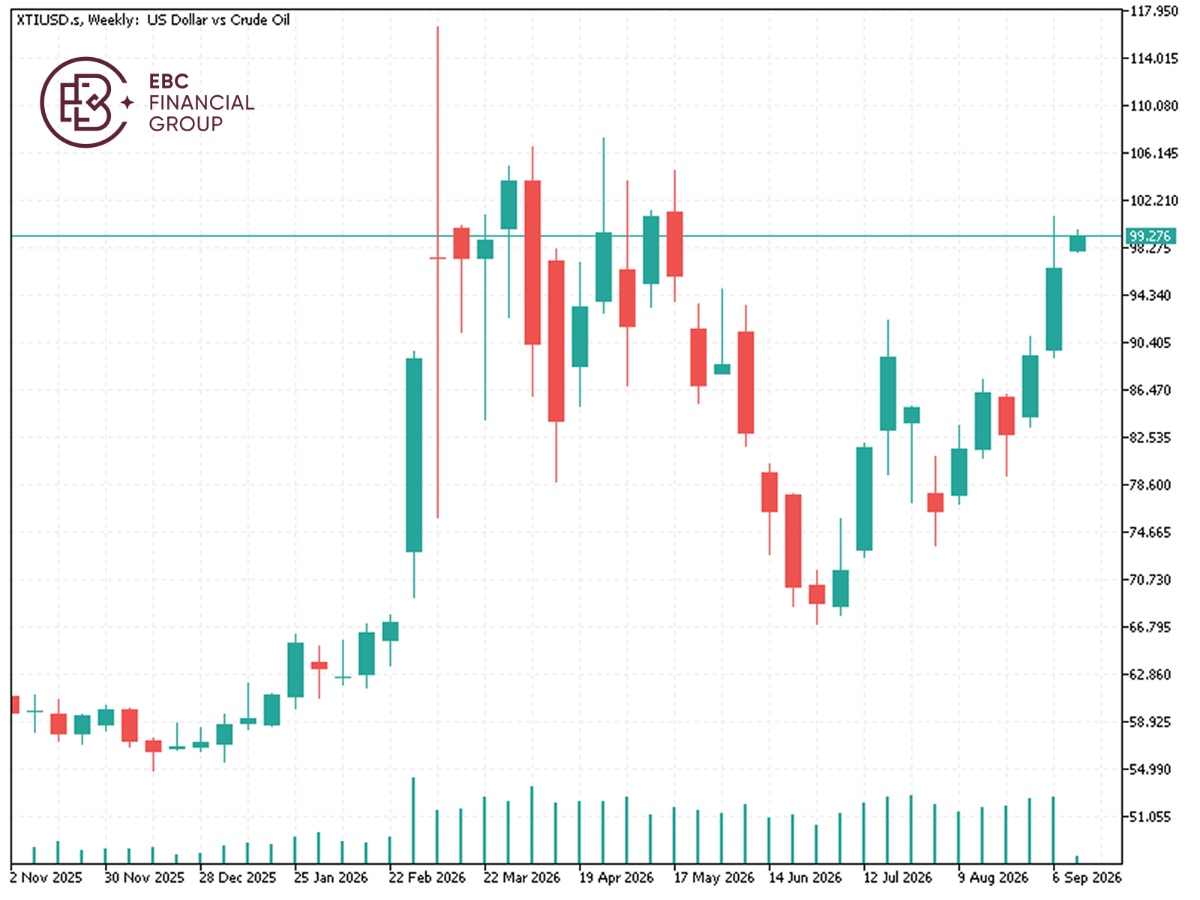
From the weekly chart, WTI crude oil futures declined sharply after forming a bearish DiNapoli“Double Repenetration”(DRPO) reversal signal during the week of May 29. In the week of July 3, prices fell to a low near $67, filling the upside gap created by the February 28 U.S.-Israeli attack on Iran.
WTI subsequently rebounded and reached the F5 resistance level around $94 in late July, where it encountered resistance and turned lower. During the week of August 7, however, crude oil found support near the COP level at $75 and resumed its advance.
Our August 17 analysis noted“from a technical perspective, WTI crude oil futures are currently locked in a range-bound battle between bulls and bears, with the bears holding a slight advantage. Over the next several weeks, if WTI can break above and hold the F5 resistance level at $94, it will open the door to further upside. Otherwise, it will most likely eventually break below the early-July low near $67.”
Over the following four weeks, WTI continued to grind higher. Last week, it surged sharply and decisively broke above the F5 resistance level at $94. Therefore, based on the framework laid out in my August 17 analysis, the path to further upside has now opened.
Last Friday, September 11, WTI rallied into the confluence resistance zone around F5 = $99 and COP = $103, where it began to encounter resistance. WTI may experience some pullback early next week, but it is likely to subsequently break above last Friday’s high.
Looking further ahead, the key areas where WTI could potentially form a bearish reversal and turn lower again are:
COP = $103, the April 30 high near $110, and the March 9 high near $119.
The key will be whether WTI develops a bearish reversal pattern on the daily chart as it reaches any of these three price zones. Such a pattern would provide the technical confirmation needed to identify a potential reversal.
UK Brent Crude (XBRUSD)
US West Texas Oil (XTIUSD)
Vanguard Energy ETF (VDE.P)
The fund tracks the MSCI USA IMI Energy 25/50 Index