Published on: 2025-04-17
Updated on: 2025-04-17
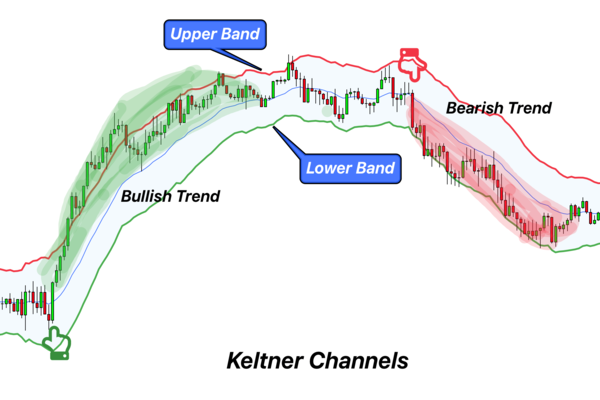
Keltner Channels are a popular technical analysis tool, widely used by traders to assess market volatility, trend direction, and potential breakout points.
By combining moving averages with volatility measures, Keltner Channels provide a dynamic framework that adapts to changing market conditions, making them valuable for both novice and experienced traders seeking to refine their trading strategies.

Keltner Channels are volatility-based envelopes set above and below a central moving average, typically an Exponential Moving Average (EMA). Developed by Chester Keltner in the 1960s and later refined by Linda Raschke, this indicator helps traders visualise the normal trading range of an asset and identify when price action may be overextended or poised for a reversal.
Unlike Bollinger Bands, which use standard deviation to set the width of the channels, Keltner Channels rely on the Average True Range (ATR) to measure volatility. This makes them less sensitive to sudden price spikes and often provides a smoother visual representation of market activity.
The Keltner Channel consists of three lines:
Middle Line: Usually a 20-period EMA of the closing price.
Upper Channel: The EMA plus a multiple (commonly two) of the ATR.
Lower Channel: The EMA minus the same multiple of the ATR.
The formulas are as follows:
Middle Line = EMA (Closing Price, Period)
Upper Band = EMA + (Multiplier × ATR)
Lower Band = EMA – (Multiplier × ATR)
The ATR is typically calculated over 10 or 14 periods, and the multiplier is often set to 2, though these parameters can be adjusted to suit different trading styles or market conditions.
1) Identifying Trends
Keltner Channels are effective for trend identification. When the price consistently trades above the middle EMA and approaches or exceeds the upper channel, it signals a strong uptrend. Conversely, if the price remains below the EMA and nears the lower channel, it indicates a downtrend.
2) Overbought and Oversold Conditions
When the price hugs or breaches the upper channel, the asset may be overbought, suggesting a potential reversal or pullback. Similarly, if the price touches or dips below the lower channel, it may be oversold, signalling a possible buying opportunity.
3) Breakouts and Volatility
Breakouts occur when the price closes outside the upper or lower channel. This can indicate the start of a new trend or an acceleration of the current trend. Traders often look for confirmation from other indicators, such as the Relative Strength Index (RSI) or MACD, before acting on breakout signals.
4) Dynamic Support and Resistance
The upper and lower bands of the Keltner Channel act as dynamic resistance and support levels. In trending markets, the price may pull back to the middle EMA before resuming its direction, offering potential entry points for trend-following strategies.
Suppose a trader is analysing a currency pair using a 20-period EMA and a 2x ATR multiplier. If the EMA is 1.2500 and the ATR is 0.0050, then:
Upper Band = 1.2500 + (2 × 0.0050) = 1.2600
Lower Band = 1.2500 – (2 × 0.0050) = 1.2400
If the price closes above 1.2600, this may signal a breakout and a potential buying opportunity. Conversely, if the price falls below 1.2400, it could indicate a bearish breakout.
Advantages:
Simple to use: Keltner Channels are straightforward, making them accessible for all traders.
Adapt to volatility: The channels expand and contract with market volatility, providing relevant support and resistance.
Versatile: Useful for trend identification, Breakout trading, and spotting overbought/oversold conditions.
Limitations:
Lagging indicator: As with all moving average-based tools, Keltner Channels may lag behind fast market moves.
False signals: In choppy or sideways markets, breakouts may not always lead to sustained trends.
Best used with other indicators: Relying solely on Keltner Channels can lead to missed or false signals; confirmation from other tools is recommended.
Tips for Using Keltner Channels
Adjust parameters: Experiment with different EMA periods and ATR multipliers to suit your trading style and the asset's volatility.
Combine with other indicators: Use tools like RSI, MACD, or volume analysis to confirm signals and reduce the risk of false breakouts.
Backtest your strategy: Test your Keltner Channel strategy on historical data to ensure its effectiveness in various market conditions.
Apply sound risk management: Always use stop-loss orders and manage your position size to protect your capital, especially during periods of high volatility.
Keltner Channels are a versatile and adaptive indicator, providing traders with valuable insights into market trends, volatility, and potential breakout opportunities. By understanding how to interpret and apply Keltner Channels, traders can enhance their decision-making and improve their overall trading performance.
Remember to use Keltner Channels as part of a comprehensive Trading plan, combining them with other indicators and robust risk management practices.
Disclaimer: This material is for general information purposes only and is not intended as (and should not be considered to be) financial, investment or other advice on which reliance should be placed. No opinion given in the material constitutes a recommendation by EBC or the author that any particular investment, security, transaction or investment strategy is suitable for any specific person.