Published on: 2026-09-15
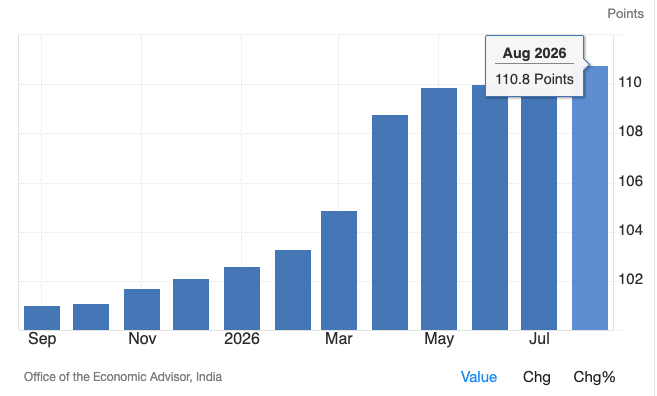
Output PPI inflation reached 9.81% in August, with the index at 110.8. WPI inflation hit 9.92% and fuel and power 22.93%.
WPI ends in five years. DPIIT launched Output PPI on 15 June 2026 and will run both indices in parallel before retiring WPI.
The IIP already uses Output PPI. It deflates 234 of 463 item groups, or 36.02% of index weight, replacing WPI.
July industrial output grew 6.7% on the new basis, with manufacturing at 7.3% and capital goods at 16.1%.
Input and output prices diverged. Trial Input PPI eased to 104.2 while Output PPI rose.
Consumer prices run five points behind. August CPI was 4.82% against producer inflation of 9.81%, with the RBI on hold at 5.25%.
India’s Output Producer Price Index rose to 110.8 in August 2026 from 109.9 in July, equivalent to 9.81% year-on-year producer inflation, while wholesale inflation edged up to 9.92%. India launched the Output PPI framework only three months ago.

WPI has long served as India’s main wholesale-price benchmark. It is now on a five-year countdown to discontinuation, with Output PPI as its successor. That handover has already reached the industrial production data. It changes what a strong IIP print tells investors about Indian companies and Indian shares.
The Office of the Economic Adviser released August figures on 14 September.
| Indicator (August 2026) | Latest |
|---|---|
| Output PPI, all commodities | 110.8 |
| Output PPI inflation | 9.81% YoY |
| WPI inflation | 9.92% YoY |
| WPI fuel and power inflation | 22.93% YoY |
| WPI manufactured products inflation | 8.37% YoY |
| Trial Input PPI, manufacturing | 104.2 |
The Output PPI index climbed from 109.9. Mining and quarrying reached 122.0 and manufactured products 109.7, while electricity slipped to 90.9 from 92.4.
August was the fourth straight month with wholesale inflation above 9%. Energy did most of the work. Mineral oils rose 38.48% and crude petroleum and natural gas 34.41%, against a fuel and power group that was in deflation a year earlier. The group index still climbed from 105.4 to 108.3.
Pressure ran wider than fuel. Chemicals rose 14.30%, textiles 12.63% and basic metals 10.88%. Primary articles cooled to 7.76%. Cumulative WPI inflation for April to August sits at 9.56%, against -0.20% a year earlier.
The print landed with Indian markets closed for Ganesh Chaturthi, so there was no same-day reaction. Equities entered the break on a fifth consecutive weekly decline, the Nifty 50 at 23,398.10 and the Sensex at 74,781.76 on 11 September, with Brent above $100 a barrel. For the broader channel, see how imported energy costs can reach Indian equities.
DPIIT launched the new series on 15 June 2026 alongside a rebased WPI, both on a 2022-23 base year. Three products arrived together: Output PPI, a trial Input PPI for manufacturing, and Service PPIs for seven services including banking, insurance, railways and telecom.
India has not abolished WPI overnight. Because WPI remains widely used in price-escalation clauses, it will run alongside PPI for five years before being discontinued.
The department framed the transition as aligning Indian price statistics with practice in advanced economies and with IMF recommendations. Publishing output and input measures together shows how far producers absorb cost increases before passing them on.
WPI captures wholesale-level commodity prices. Output PPI is built around prices received by domestic producers. Both are compiled at basic prices, excluding net taxes and trade and transport margins.
A factory’s production value can rise 10% while the number of units leaving the line stays flat, simply because selling prices went up. Statisticians strip out that price effect with a deflator before calling any of it real growth.
In June, MoSPI replaced WPI with Output PPI as the deflator for every IIP item group where production is collected in value rather than volume terms. That covers 234 of the 463 item groups, or 36.02% of total index weight. The entire 2022-23 series was revised and supersedes the WPI-deflated version published on 1 June.
MoSPI cited the finer price structure of Output PPI and better real-output estimation for value-based items. Since IIP feeds quarterly GDP, the change also opens the path to PPI-based volume estimation in the national accounts.
July industrial production, compiled on the revised basis, grew 6.7% year on year. Manufacturing rose 7.3% and the headline index reached 124.8 against 117.0 a year earlier. Capital goods gained 16.1% and consumer durables 10.5%, while mining contracted 0.9%.
With producer inflation near double digits, the deflator now does heavy lifting on how nominal production converts into real output, and it does so unevenly across industries.
Input costs, then selling prices, then margins.
The two ends moved apart in August. The trial manufacturing Input PPI fell to 104.2 from 105.9 while Output PPI rose to 110.8, with coke and refined petroleum inputs dropping to 86.7 from 99.9. That is a clue on cost pressure, not a margin measure. The series differ in coverage and weighting, and the input index is experimental and manufacturing-only.
The wider gap is between producers and consumers. Producer prices rose 9.81% in August, consumer prices 4.82%. Weighting explains part of it, since CPI leans on food and services while retail fuel is buffered by excise. The rest is either being absorbed by producers and retailers or still travelling down the chain. Earnings will settle it, most visibly in chemicals, metals, automobiles and packaged consumer goods.
Currency belongs in the same frame. A weaker rupee lifts the local-currency cost of imported inputs and capital equipment, while exporters convert foreign-currency revenue into more rupees. Recent USD/INR price action supplies the near-term context.
None of this transmits mechanically to share prices. India’s strong GDP growth has not automatically translated into equity returns, and producer inflation is not a standalone signal.
Four things from here.
Persistence. Whether Output PPI inflation holds near 9.81% or rolls over as the fuel base effect fades.
The input-output relationship. Whether manufacturers’ input costs turn higher again after August’s decline.
Pass-through. Whether the producer-to-consumer gap narrows from the top or the bottom, and how that reads in the October to December earnings season.
Real activity. Whether industrial volumes keep expanding after PPI deflation. August IIP is due on 28 September, with September price data on 14 October.
India’s monetary-policy target is defined in headline CPI rather than producer inflation, so no single PPI or WPI print dictates policy. The Monetary Policy Committee held the repo rate at 5.25% on 5 August in a unanimous vote, kept a neutral stance and trimmed its FY27 CPI projection to 5%.
Governor Sanjay Malhotra described the central bank as “neither dovish nor hawkish” and said it would remain guided by headline inflation. The next review runs from 5 to 7 October.
August points to a two-speed price economy. Producer costs near double digits, consumer prices near half that, and five percentage points absorbed somewhere between the factory gate and the till. Third-quarter results will show whether that was pricing power, margin compression, or growth that looked larger in rupees than in volume.