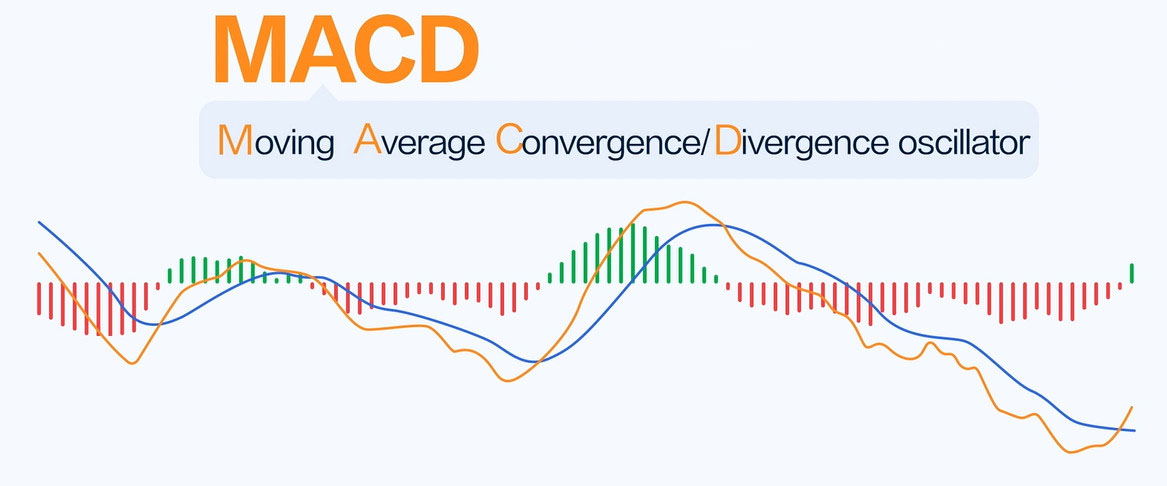
MACD should first calculate the fast (usually 12 days) Moving Average value
and the slow (usually 26 days) moving average value in the application. Use
these two values as the basis for measuring the "difference value" between the
two (fast and slow lines).
The so-called "difference value" (DIF) refers to the 12 day EMA value minus
the 26 day EMA value. Therefore, in the sustained upward trend, the 12th EMA is
above the 26th EMA. The positive deviation value (+DIF) between them will become
larger and larger. On the contrary, in a downward trend, the difference value
may become negative (-DIF) and also increase.
As for the degree to which the positive or negative deviation value needs to
be reduced when the market starts to turn around, it is truly a signal of market
reversal. The reversal signal of MACD is defined as the 9-day moving average
(9-day EMA) of the "difference value".

The calculation formula for MACD indicators involves three parts: a fast
line, a slow line, and a bar chart.
1. Calculate the fast line (EMA12).
Firstly, it is necessary to calculate the 12-day average index (EMA12) of the
closing price, which is:
EMA12=Previous day EMA12 x 11/13+ Today's closing price x 2/13
Among them, 11/13 and 2/13 are weighting coefficients that can be adjusted
according to different analysis requirements.
2. Calculate the slow line (EMA26).
Next, it is necessary to calculate the 26-day average index (EMA26) of the
closing price, which is:
EMA26=Previous day EMA26 x 25/27+ Today's closing price x 2/27
Similarly, 25/27 and 2/27 are weighted coefficients.
3. Calculate bar charts (DIF and DEA).
Finally, the difference between the fast and slow lines can be used as a bar
chart (DIF) to measure price momentum and trend changes while also calculating
the 9-day moving average (DEA) of the DIF, which is:
DEA=previous day's DEA x 8/10 + today's DIF x 2/10
Finally, the calculation formula for MACD indicators can be expressed as:
MACD=DIF-DDEA
Its IF is the difference between the fast line and the slow line, DEA is the
9-day moving average of DIF, and MACD is the bar chart. It should be noted that
the value of the MACD index can be positive, negative, or zero, and its size and
direction reflect the change and trend intensity of market prices.


