Published on: 2023-09-11
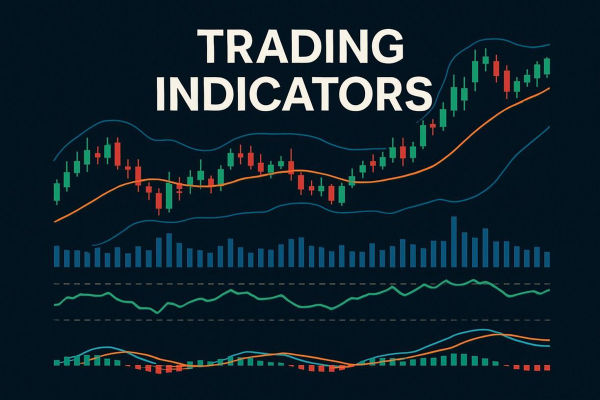
Technical indicators are an indispensable tool in trading. Whether you are a novice selling investment markets or an experienced veteran, you will add some technical indicators to the charts. Today, we will discuss two major categories of indicators: trend indicators and volatility indicators. We will explore the differences between these two indicators, their advantages and disadvantages, and when they should be used. We will also introduce the key points to pay attention to when using these indicators.
Trend indicators
As the name suggests, trend indicators are indicators set based on trend theory, with the most typical being the Moving Average. In addition, Bollinger channels and parabolic indicators are also common trend indicators. Trend indicators are suitable for markets with significant upward trends. After identifying the strongest or weakest performing varieties in the market, they buy at a higher price and then sell at a higher price to earn profits. When the market is stimulated by clear positive news, trend indicators perform quite well. However, in the absence of clear market conditions, the performance of trend indicators may be affected. When the market enters a volatile market, trading with trend indicators may lead to a sharp drop in prices after buying and a sharp increase in prices after selling.
Once a trend is formed, it usually continues until a reversal signal appears. Therefore, the key to using trend indicators is to always follow the trend after the trend signal is issued, until the system sends a signal of trend reversal. For example, many people use the fifty-day moving average to determine current market trends. If the price is above the fifty-day moving average, it indicates that the market is in an upward trend. On the contrary, if the price is below the fifty-day moving average, it indicates that the market is in a downward trend. When prices consolidate around the 50-day moving average, it indicates that the current trend is uncertain or there may be a reversal. Some investors also use the five-day moving average and the ten-day moving average to judge whether they are long or short. For example, when the five-day moving average breaks through the ten-day moving average upwards, it is called a golden cross, indicating that the market has recently performed strongly. Conversely, when the daily moving average overturns, it is called a dead cross, indicating that the market may decline.
Awesome Oscillator
Compared to trend indicators, the idea of oscillation indicators is exactly the opposite. They have a potential fair price based on price, and prices will fluctuate around this price level. When the price drops to a relatively low level, it is possible to consider buying at the bottom. When the price rises to a higher level, one should consider selling short. In short, the volatility indicator is a trading system that buys low and sells high. Common volatility indicators include RSI, kdj, etc., which usually set overbought and oversold areas. For example, when both RSI and KDJ set 80 and 20 as overbought and oversold lines, and when the indicator is above 80, it indicates that the market is in an overbought state and should consider selling or short selling; when the indicator is below 20, it indicates that the market is in an oversold state and should consider buying or going long.
| Trend Indicators | Oscillation Indicators | |
| Typical Examples | Moving Averages, Bollinger Bands, Parabolic SAR | RSI, KDJ, etc. |
| Applicable Market Conditions | Suitable for markets with clear upward trends | Suitable for oscillating markets |
| Trading Strategy | Buy at high prices, sell at higher prices | Buy at low prices, sell at high prices |
| Signal Basis | Relies on trend theory | Based on fair price oscillations |
| Nature of Signals | Long-term trends and reversal signals | Short-term buy/sell signals |
| Buy High, Sell Low | Buy in uptrends, sell in downtrends | Sell in overbought, buy in oversold conditions |
| Risks | May be affected in the absence of clear market trends or in oscillating markets | Potential for price drops after buying, price surges after selling |
| Signal Duration | Continues until a reversal signal occurs | Short-term buy/sell signals with shorter durations |
summary
Depending on the market environment, each indicator has a unique purpose. Trend indicators perform well in markets with significant gains, while volatility indicators perform better in volatile markets. Therefore, when using technical indicators, it is important to select appropriate indicators based on the current market environment. To clarify whether the market is in a volatile or unilateral situation, it will help you better utilize technical indicators to guide trading decisions. Whether you are a novice or a veteran, understanding and applying these indicators will help improve your trading skills and help you better cope with different market conditions.
Disclaimer: This material is for general information purposes only and is not intended as (and should not be considered to be) financial, investment or other advice on which reliance should be placed. No opinion given in the material constitutes a recommendation by EBC or the author that any particular investment, security, transaction or investment strategy is suitable for any specific person.


World's Best Broker