As of 8 October 2025. AUD/USD is trading around 0.6561. down 0.41% over the past week.

The US Dollar Index (DXY) sits at 98.81 and the US 10-year Treasury yield is about 4.11%, reinforcing dollar strength.

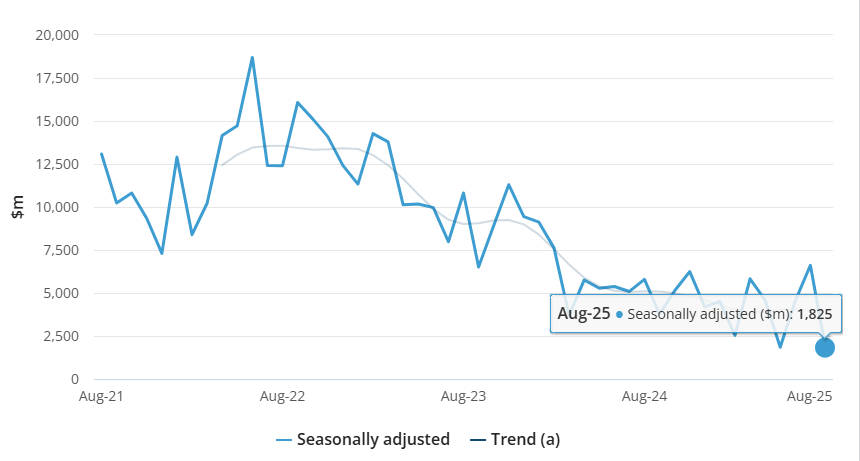
Australia's Bureau of Statistics reported that the August trade surplus narrowed to A$1.825 million (released 2 Oct 2025), versus A$6.612m in July, a sharp deterioration that adds a clear near-term headwind for the Aussie.

With the U.S. dollar still in demand amid safe-haven flows and sticky U.S. macro prints, the Aussie is under pressure. In short: poor trade performance at home and a resilient dollar abroad are forming a heavy crosswind for AUD/USD.
Key Drivers Pressuring AUD/USD
1) Sharp Trade Slump & Commodity Exposure
The sudden collapse in the surplus to A$1.8 billion (from A$6.6 billion) marks the weakest reading in months.
Exports fell by 7.8%, with the gold sector particularly hit by a 47 % drop in non-monetary gold shipments.
Australia's Goods Trade Balance, Seasonally Adjusted (June–August 2025)
|
|
Jun 25 ($m) |
Jul 25 ($m) |
Aug 25 ($m) |
Jul 25 to Aug 25 ($m) |
Jul 25 to Aug 25 (%) |
| Balance on goods |
|
4,546 |
6,612 |
1,825 |
-4,787 |
na |
|
Credits (Exports of goods) |
44,281 |
45,410 |
41,858 |
-3,552 |
-7.8 |
|
Debits (Imports of goods) |
-39,735 |
-38,798 |
-40,033 |
1,235 |
3.2 |
Source: Australian Bureau of Statistics, International Trade in Goods August 2025
Imports rose by 3.2% across consumer goods, telecom, and aircraft equipment.
Given Australia's exposure to commodity cycles and Chinese demand, such sudden drops amplify downside pressure on the AUD.
2) Yield and Rate Differentials
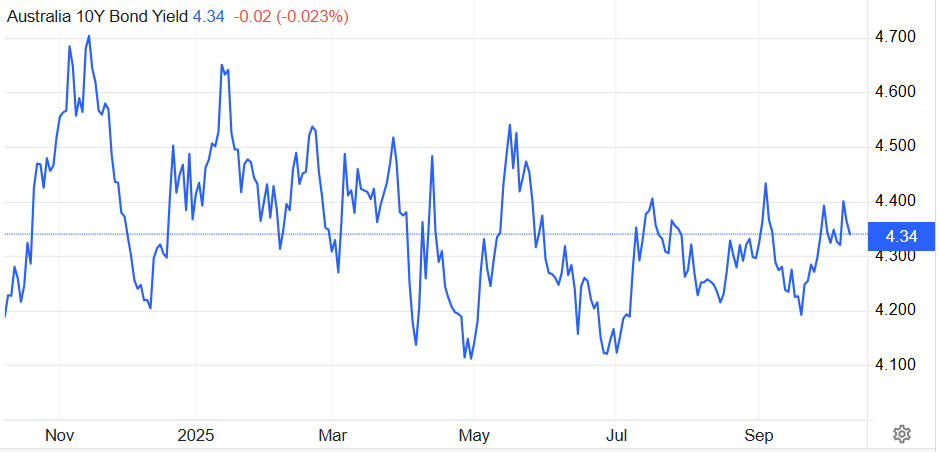
Australia's 10-year yield of 4.41 % points to rising domestic borrowing costs.

If U.S. yields remain elevated or if the Fed maintains a hawkish tilt, the interest rate gap may increasingly favour the dollar.
3) Global Sentiment & USD Safe-Haven Demand
In times of risk aversion, the U.S. dollar remains the default safe-haven currency. Ongoing geopolitical risks, macro surprises, or global growth jitters tend to funnel flows into the greenback, putting further downside pressure on AUD/USD.
Technical Landscape: Consolidated With Weak Bias
On the upside, the resistance zone lies between 0.6625 and 0.6688.
On the downside, initial support sits near 0.6540. with the next key floor around 0.6410.
Momentum indicators remain mixed; the lack of a strong trend suggests the pair may continue to chop unless a catalyst emerges.
AUD/USD Scenario Outlook
| Scenario |
Conditions / Triggers |
Potential AUD/USD Range |
| Bullish |
Surprise rebound in trade and commodity demand, softer U.S. inflation, Fed hints at earlier cuts |
0.6670 – 0.6750 |
| Base / Neutral |
Mixed data from both sides, no clear directional catalyst |
0.6520 – 0.6670 |
| Bearish |
U.S. inflation surprises, further deterioration in Australia's trade and growth, safe-haven risk spikes |
0.6410 – 0.6520 |
A decisive break above 0.6670 might reignite bullish momentum, but failure could send the pair deeper into the support zone.
Upcoming Catalysts to Watch
Australia: Next trade balance release, CPI, employment, retail sales
U.S.: CPI, PCE core inflation, nonfarm payrolls, Fed communications
China: industrial production, stimulus signals, property sector news
Global: risk sentiment shifts, commodity price swings, geopolitical developments
Conclusion
The AUD/USD outlook now faces headwinds on multiple fronts: external demand softness (especially in commodities), tightening bond yields, and a resilient U.S. dollar. Australia's sudden trade slump suggests the domestic external sector is more fragile than expected.
For traders, this environment favors caution and precision: avoid chasing breakouts without confirmation, and keep stops tight. For Australian exporters, a weaker AUD provides some competitive cushion, but for importers and consumers it adds cost pressures and inflationary risk.
Frequently Asked Questions
Q1. Why is the AUD/USD falling in October 2025?
The Australian dollar has weakened mainly due to a sharp drop in Australia's August trade surplus (down to A$1.8 billion from A$6.6 billion in July) and persistent U.S. dollar strength. Robust U.S. Treasury yields near 4.1% and hawkish comments from Federal Reserve officials have kept the dollar in demand.
Q2. How does the U.S. Federal Reserve affect the AUD/USD rate?
The Federal Reserve's policy outlook strongly impacts global currency flows. When U.S. rates stay higher for longer, dollar yields become more attractive to investors, causing capital outflows from risk currencies such as the Australian dollar.
Q3. What role does China's economy play in AUD/USD movements?
China is Australia's largest trading partner, particularly for iron ore and coal exports. Any slowdown in Chinese demand or weak industrial activity tends to reduce Australia's export income, putting downward pressure on the AUD.
Q4. Is the Reserve Bank of Australia (RBA) likely to raise rates again?
As of October 2025. markets expect the RBA to hold its cash rate at 4.35% for the rest of the year. Softer inflation data and weaker trade figures have reinforced expectations that the tightening cycle is over, unlike the Fed, which remains open to further hikes.
Q5. What are key technical levels to watch for AUD/USD?
Immediate support lies near 0.6550. while resistance is seen around 0.6620. A decisive break below 0.6550 could open the way to 0.6500. whereas a rebound above 0.6620 may signal short-term recovery potential.
Q6. What could reverse the downtrend in AUD/USD?
A sustained rebound in commodity prices, stronger Chinese growth data, or a dovish shift by the Fed could help the Australian dollar regain momentum against the greenback.
Disclaimer: This material is for general information purposes only and is not intended as (and should not be considered to be) financial, investment or other advice on which reliance should be placed. No opinion given in the material constitutes a recommendation by EBC or the author that any particular investment, security, transaction or investment strategy is suitable for any specific person.


