Published on: 2026-08-17
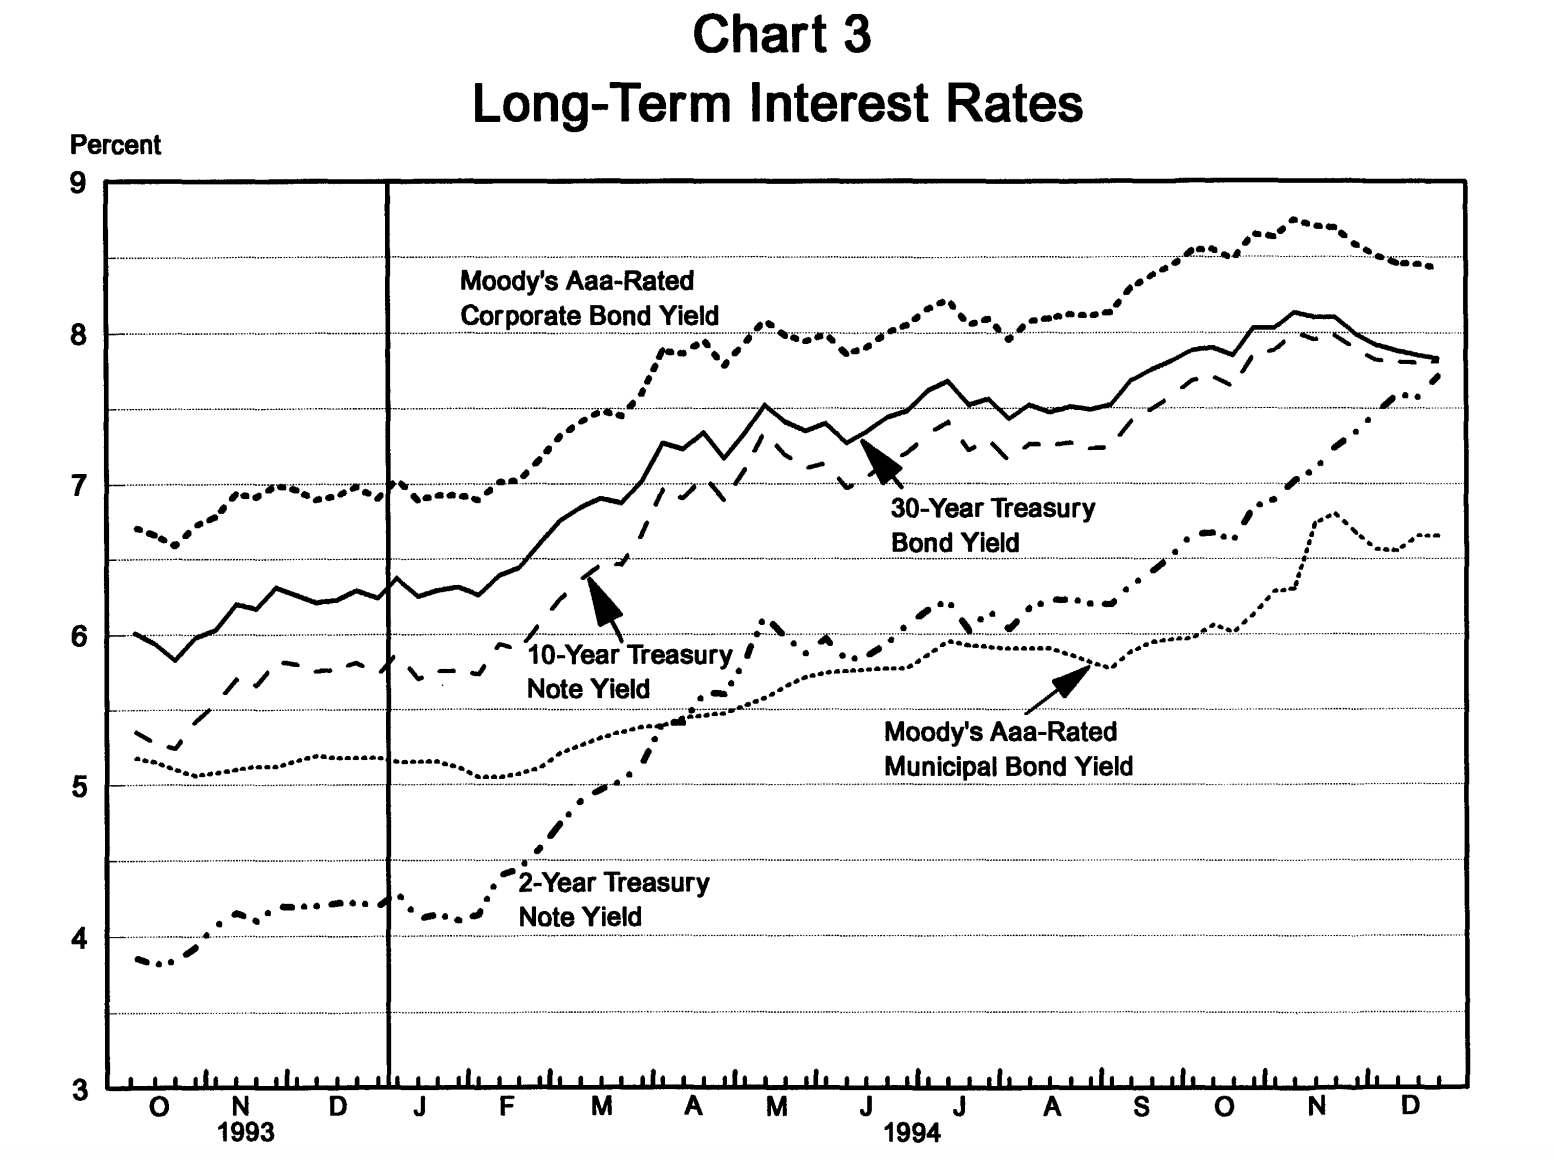
On 4 February 1994, the Federal Reserve raised interest rates by 25 basis points. By year-end, Treasury yields had climbed sharply across the curve as a US bond selloff spread through major global markets.
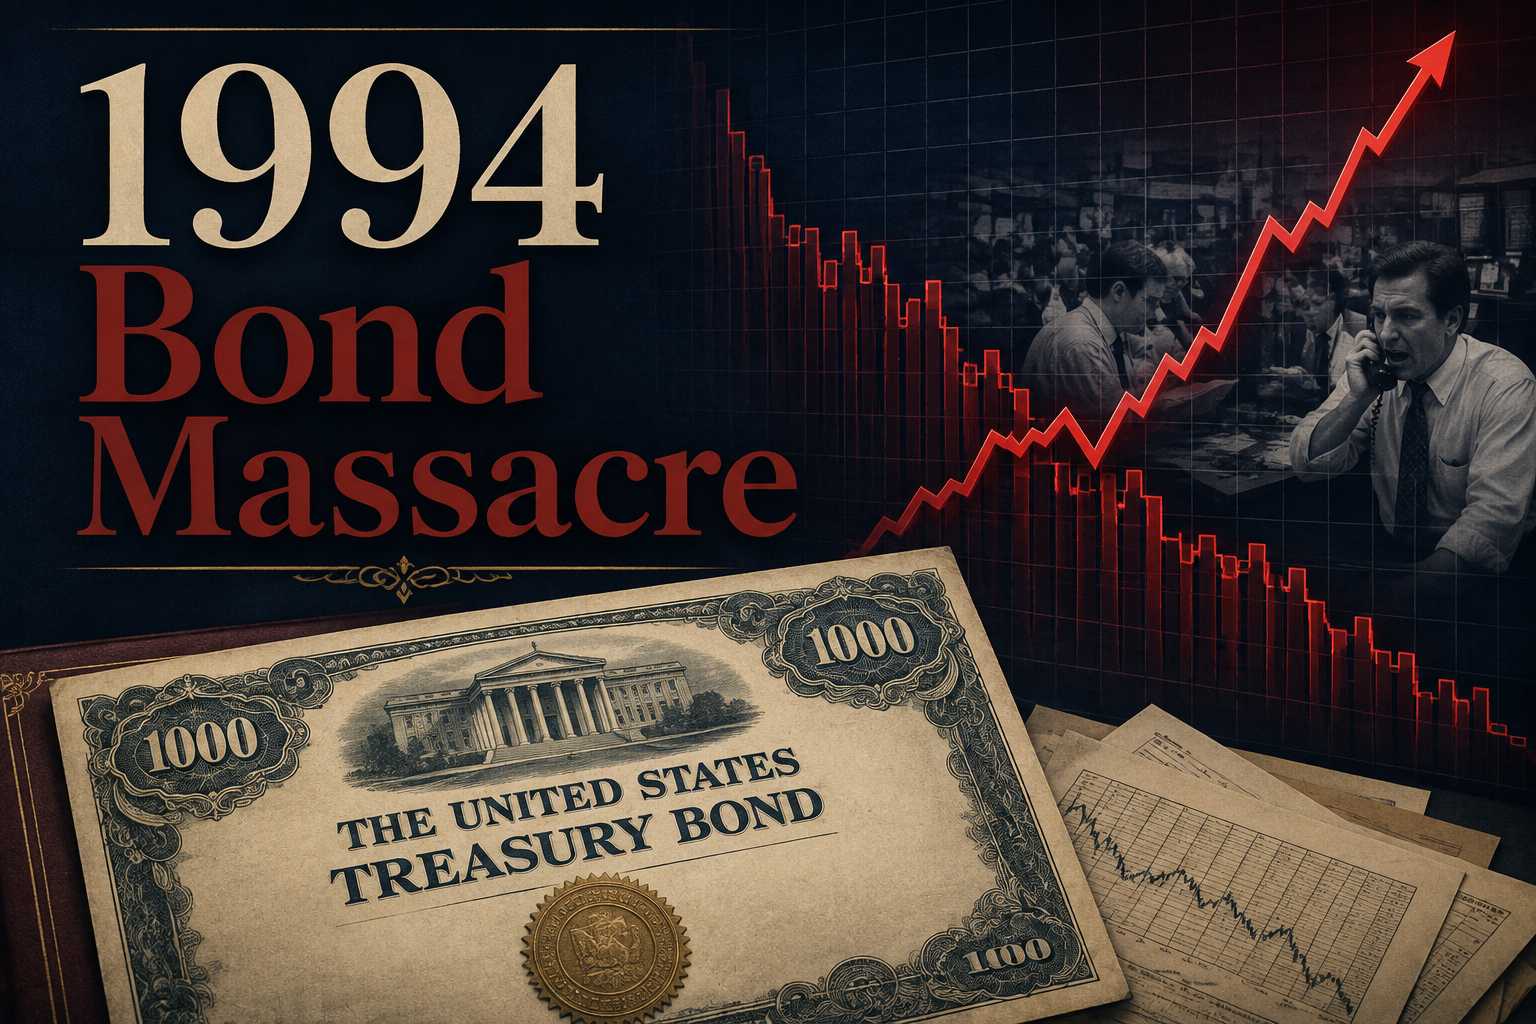 The damage did not require a US government default or recession. Investors had built portfolios around a relatively benign rate outlook, and that assumption changed faster than many positions could absorb. Long-duration bonds suffered the largest price declines, while leverage forced some holders to sell before those losses could recover.
That is why 1994 keeps returning to market conversations. In August 2026, the US 30-year Treasury yield has again moved above 5% while the Fed holds its policy rate at 3.50%-3.75%. The circumstances are different, but the episode remains a useful case study in how a change in rate expectations can spread through the bond market.
The Fed raised rates six times in 1994, taking the federal funds target from 3% to 5.5%.
Treasury yields finished the year roughly 150 to nearly 350 basis points higher, depending on maturity.
The first 25bp hike mattered because it forced investors to reassess the future path of interest rates.
Long-duration bonds suffered more as yields rose, while leverage turned market losses into forced selling.
Orange County showed how borrowing against rate-sensitive assets could turn a bad trade into a funding crisis.
High yields alone do not recreate Bond Massacre 1994. A broader expectations shock and forced deleveraging would make the comparison much stronger.
The Fed entered 1994 with the federal funds target around 3%. Its 25bp increase on 4 February was the first move of a tightening cycle that eventually included five more hikes: 25bp in March, 25bp in April, 50bp in May, 50bp in August and 75bp in November. By the final increase, the target had reached 5.5%.
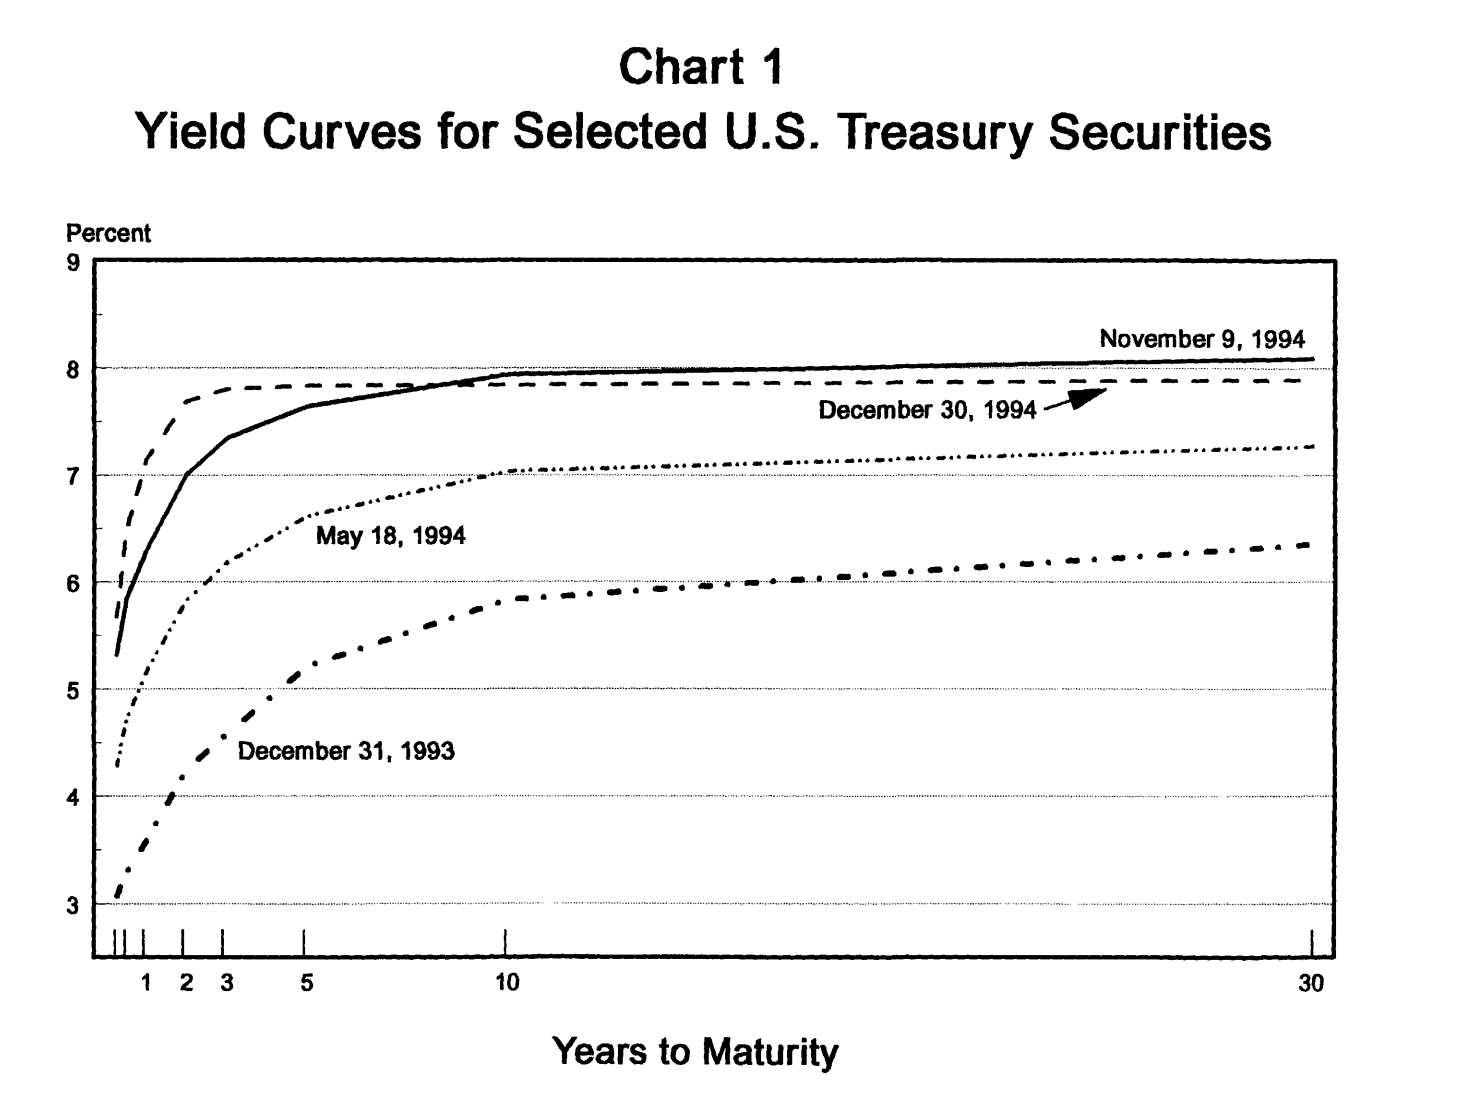
Bond markets moved much faster than the Fed. Treasury coupon yields ended the year roughly 150 to nearly 350 basis points higher, depending on maturity. By mid-May, the two-year yield had already risen about 280bp and the 30-year more than 110bp.
The 30-year Treasury yield eventually breached 8%, while a New York Fed index of long-term Treasuries lost roughly 7.5% for the year. The securities continued to pay their coupons and retained the backing of the US government. Their market prices fell because investors could suddenly earn much higher yields from newly issued bonds.
Treasuries remained creditworthy throughout the selloff. The losses came from rising yields pushing existing bond prices lower.
The first increase was small, but it challenged an assumption that had shaped portfolios for years.
Bond investors had benefited from falling yields, while cheap short-term funding made it attractive to borrow at low rates and hold longer-dated securities. A continuation of relatively easy monetary policy was therefore embedded in both bond prices and investment strategies.
Once the Fed began tightening, investors had to reconsider the entire expected rate path. A ten-year Treasury does not respond only to today’s overnight rate; its price reflects expectations for rates over much of the decade ahead. If those expectations shift higher, the bond can reprice immediately.
That is why markets did not wait for the full 250bp tightening cycle. By early May, the Fed had delivered only 75bp of increases, yet market yields had already moved substantially further in anticipation of what might come next.
The February hike therefore mattered less for its size than for the message it sent: the low-rate regime investors had priced into bonds could be ending.
When market yields rise, older fixed-rate bonds become less attractive because new securities offer higher returns. Their prices must fall until the yield becomes competitive again.
Duration estimates how sensitive a bond’s price is to a change in rates. It is calculated from the timing and size of a bond’s future cash flows and should not be confused with maturity. As a rough approximation, a bond with a duration of five years could lose about 5% if yields rise by one percentage point, before allowing for convexity and other effects.
Long-dated bonds generally carry greater duration because more of their cash flows arrive further into the future. A short-maturity bond may suffer a relatively modest decline from a 100bp move, while a long bond with duration above ten can face a much larger mark-to-market loss.
Portfolios built during the preceding bond rally were therefore vulnerable even when the underlying securities remained perfectly capable of paying their principal. The problem was the price investors had paid for long-term fixed cash flows.
A falling bond price becomes more dangerous when the investor borrowed money to own it.
Some market participants financed positions through repurchase agreements, pledging securities as collateral for short-term borrowing. That allowed them to hold more bonds than their own capital alone could finance, magnifying both gains and losses.
As yields climbed, bond prices and collateral values fell. Lenders could demand additional cash or securities. Investors unable or unwilling to provide them had to reduce positions, creating a feedback loop:
Yields rise → bond prices fall → collateral values decline → leveraged positions are cut → additional selling pushes prices lower.
Mortgage-backed securities added another source of pressure. Higher rates reduced refinancing, keeping mortgages outstanding for longer and increasing the effective duration of mortgage portfolios. Managers seeking to offset that additional exposure could sell Treasuries or related instruments, adding to the broader rise in yields.
The selloff therefore became more than a simple reaction to Fed policy. Portfolios designed for the previous rate environment began adjusting at the same time.
The most famous casualty was Orange County, California.
By December 1994, its investment pools held about $7.6 billion in participant deposits, while borrowing had expanded the portfolio’s book value to more than $20.6 billion. The strategy relied heavily on short-term reverse repos and longer-dated securities, including derivatives that were highly sensitive to rising interest rates.
The portfolio depended on low funding costs and an interest-rate environment favourable to its longer-term holdings. Once rates rose, funding became more expensive while the value of the assets declined.
Orange County disclosed a market-value loss of roughly $1.5 billion in early December and filed for bankruptcy on 6 December. After the portfolio was liquidated, realised losses reached about $1.7 billion.
The case shows why leverage changes the nature of bond risk. An unleveraged investor may be able to wait for a bond to mature. A leveraged investor can lose that choice when collateral requirements rise. Orange County was therefore hurt not simply because rates moved against it, but because its financing structure made waiting increasingly impossible.
Long-term US borrowing costs have brought the episode back into discussion.
On 14 August 2026, the Treasury curve placed the 10-year yield around 4.68% and the 30-year near 5.25%. The Fed, meanwhile, has maintained its target range at 3.50%-3.75%. The comparison has limits.
| 1994 | August 2026 | |
|---|---|---|
| Fed policy | Six hikes, 3% to 5.5% | Holding at 3.50%-3.75% |
| Main repricing | Expected policy path moved sharply higher | Long-end yields remain elevated |
| Yield curve | Broad rise and flattening | Greater pressure at long maturities |
| Forced deleveraging | Visible across leveraged portfolios | No comparable systemic episode evident |
| Main risk to watch | Leveraged positions forced to unwind | Whether high long yields trigger broader deleveraging |
Today’s long-end pressure has been linked to real yields, Treasury issuance, inflation uncertainty and term premium. EBC’s analysis of the 2026 bond market pressure point examines those forces, while its breakdown of 30-year borrowing costs above 5.2% explains why long yields can remain elevated even when expectations for near-term Fed tightening soften.
Absolute yield levels tell only part of the story. The closer comparison is whether rising yields begin forcing leveraged investors to unwind. In 1994, that process became visible across markets as the repricing broadened and funding pressure intensified.
A 30-year yield above 5% is not enough. A closer resemblance would require several pressures to emerge together:
Markets sharply raise their expected path for policy rates.
Yields rise rapidly across short, intermediate and long maturities.
Bond volatility remains elevated rather than spiking briefly.
Leveraged strategies face significant collateral or margin calls.
Forced liquidations begin reinforcing the initial decline.
Selling spreads across international bond markets.
The point at which a selloff becomes more dangerous is when investors begin selling because financing or risk limits require it. That mechanism can turn a normal repricing into a self-reinforcing one.
Bond yields rose rapidly after the Fed began a tightening cycle that markets had underestimated, producing unusually large losses across fixed-income portfolios. Leveraged positions and forced liquidation amplified the initial repricing.
The Fed raised rates six times during 1994, taking the federal funds target from 3% at the start of the cycle to 5.5% by November.
No. US Treasuries continued to make their promised payments. Their market prices fell because interest rates rose, making previously issued lower-yielding bonds less valuable.
A similar mechanism remains possible if a large change in rate expectations collides with heavy duration exposure, leverage and forced selling. High bond yields on their own would not be enough.
The 1994 bond massacre began when investors realised the interest-rate path embedded in bond prices was wrong. The Fed’s tightening cycle forced a rapid repricing, and leveraged portfolios turned some of those losses into forced sales.
The number on the 30-year Treasury was not what made 1994 a massacre. The break came when investors discovered their rate assumptions were wrong and leveraged positions could no longer wait for prices to recover.
That remains the test for every future comparison with 1994.
Federal Reserve Bank of New York - Open Market Operations during 1994
https://www.newyorkfed.org/medialibrary/media/markets/omo/omo94.pdf
Federal Reserve Board - 1994 FOMC Historical Materials
https://www.federalreserve.gov/monetarypolicy/fomchistorical1994.htm
SEC - Orange County Investigation
https://www.sec.gov/enforcement-litigation/reports-investigations/municipal-bond-participants-public-officials