Published on: 2026-06-22
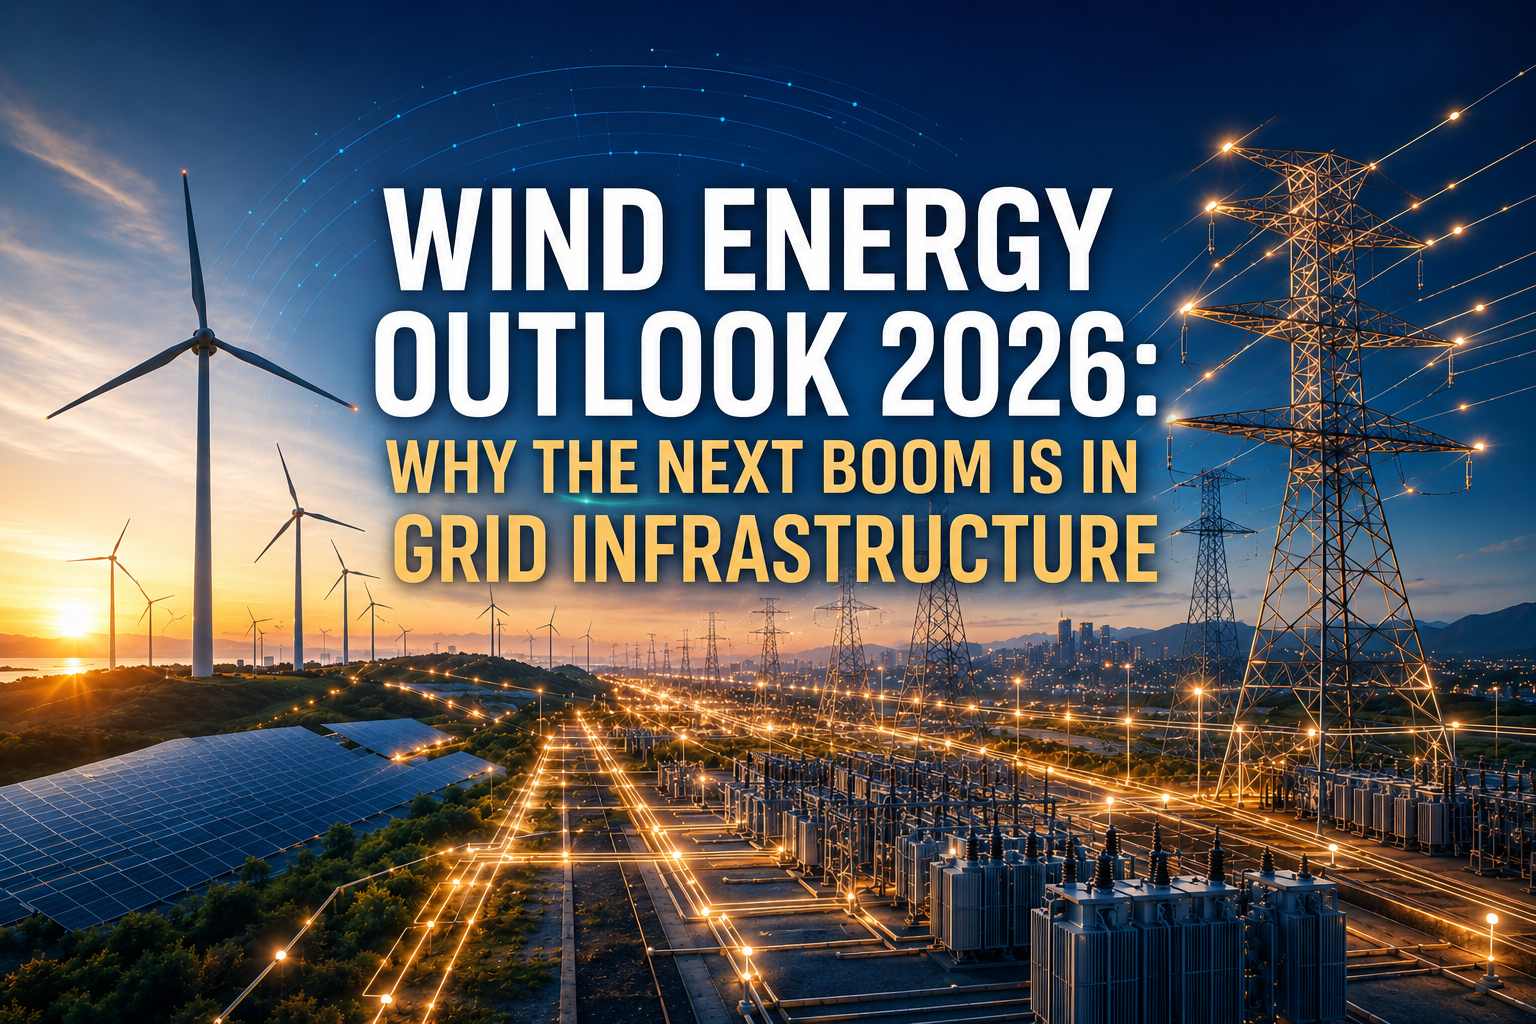
Wind had its best year on record in 2025, with 165 GW of new capacity installed and global capacity rising to 1,299 GW. Yet the sector enters 2026 with a different constraint from the one it faced a decade ago. Turbines can now be built at scale. The harder question is whether power networks can absorb, move, and monetise the electricity.
That is where the market story has shifted. More than 2,500 GW of renewable, storage, and large-load projects now sit in grid queues worldwide, while annual grid investment needs to climb roughly 50% from today’s $400 billion by 2030. The next phase of wind energy investment is therefore less about turbine count and more about connection certainty, transmission capacity, storage, and the equipment required to upgrade power systems.
For traders, this turns wind from a simple clean energy theme into an infrastructure repricing cycle. The strongest signals are likely to come from the gap between projects that can reach the grid and those that remain stuck behind physical bottlenecks.

Wind added a record 165 GW in 2025, up 40% on the year, confirming its role as core power infrastructure.
Onshore wind remains the near-term engine, with 155.3 GW of additions, or more than 94% of new installations.
Offshore wind added 9.3 GW in 2025 and now trades increasingly on jurisdiction, policy stability, and grid planning.
Transmission, transformers, cables, substations, and storage are becoming the sector’s main scarcity points.
Onshore wind is still the most bankable part of the sector. It is cheaper, quicker to build, and less dependent on specialised vessels, ports, subsea cables, and offshore substations. In a market where financing costs still matter, that gives onshore projects a clearer path from investment decision to revenue.
The numbers underline the point. Of the 165 GW added globally in 2025, 155.3 GW was onshore. Offshore managed 9.3 GW, under 6% of the total. That does not weaken the long-term offshore case, but it does show why onshore remains the deployment engine for 2026.

Growth is also heavily concentrated. China added 120.5 GW, roughly 73% of the world’s new capacity. India reached a record 6.3 GW, the US rebounded to nearly 7 GW onshore, and Europe installed 19.1 GW, around 90% of it on land.
| Market Signal | 2025 Figure | Trading Read |
|---|---|---|
| Global wind additions | 165 GW | Record demand confirms scale |
| Onshore additions | 155.3 GW | Main source of near-term capacity |
| Offshore additions | 9.3 GW | Strategic, but execution-heavy |
| China additions | 120.5 GW | Global supply-chain anchor |
| Europe additions | 19.1 GW | Grid and permitting define upside |
| India additions | 6.3 GW | Emerging-market growth signal |
The investment distinction is no longer capacity alone. Announced megawatts are abundant; bankable megawatts are scarce. A developer with permits, an offtake agreement, and firm grid access carries lower revenue risk than a larger rival with delayed projects in the queue.
Offshore wind has better natural economics in some respects: larger turbines, stronger wind resources, and proximity to coastal demand centres. Its challenge is execution. Each project requires vessels, seabed permits, port availability, subsea cables, offshore substations, and long-dated financing to align.
That complexity is why offshore wind no longer trades as a single global theme. Europe is the stronger side of the market because North Sea governments are treating offshore wind as shared infrastructure, linking generation with cross-border transmission through subsea interconnectors. Europe’s wider wind market still expanded by 19.1 GW in 2025, giving its offshore strategy a stronger base despite permitting and network constraints.
The US carries a higher policy discount. Roughly $2.6 billion of lease buybacks, including a $765 million deal covering four early-stage projects, has redirected capital toward other energy assets and left parts of the federal offshore pipeline under pressure. The wind resource remains attractive, but the policy signal is less stable.
The split is already visible. Globally, 9.3 GW of offshore wind capacity was added in 2025, while just 11.4 GW of new offshore capacity was awarded, about a fifth of 2024’s record. For now, jurisdiction matters as much as wind speed.
Floating turbines can reach deep-water wind off Japan, South Korea, Norway, and the US Pacific Coast, where fixed-bottom foundations are less practical. The resource potential is large, but commercial scale remains limited.
The issue is cost and supply-chain maturity. Floating wind still needs cheaper platforms, proven mooring systems, dynamic cables, floating substations, and ports capable of handling larger hardware. That makes it a long-horizon option rather than a near-term earnings driver.
The cleaner exposure may sit upstream. Cable makers, marine contractors, port operators, and specialist engineers can win orders before floating wind developers generate meaningful returns. In this segment, the suppliers may monetise the theme earlier than the project owners.
The central mismatch is timing. A wind farm can often be developed in 1 to 5 years. The transmission line needed to carry its power can take 5 to 15 years. That gap creates congestion, curtailment, and scarcity value across the grid supply chain.

Curtailment is the clearest financial symptom. When the network cannot take the output, turbines are switched off and finished capacity earns nothing. This weakens project returns and raises the value of any asset that can reduce congestion or improve deliverability.
| Bottleneck | Market Effect | Trading Implication |
|---|---|---|
| Transmission delays | Projects wait years to connect | Grid-access assets trade at a premium |
| Curtailment | Revenue is lost despite installed capacity | Storage and flexibility gain value |
| Transformer shortages | Project timelines stretch | Equipment makers gain pricing power |
| Subsea cable demand | Offshore wind competes with interconnectors | Cable backlogs support margins |
| Congested queues | Cash-flow timing becomes uncertain | Connected developers command higher multiples |
The pricing reflects the shortage. Transformer, switchgear, and high-voltage cable prices have nearly doubled in five years, pressuring developers that failed to lock in costs but rewarding suppliers with spare capacity and visible backlogs.
Grid-enhancing technologies add a faster layer of relief. Reconductoring, dynamic line rating, advanced power-flow control, and storage used as transmission can increase usable capacity without waiting years for new lines. These tools do not replace large grid investment, but they can unlock projects that are already close to connection.
The first is onshore over offshore. Onshore offers faster build times, lower engineering risk, and less exposure to marine infrastructure bottlenecks. Offshore offers larger long-term potential, but its returns are more sensitive to policy, financing, and supply-chain execution.
The second is connected over queued. Developers with secured grid access should command stronger valuations than companies holding large but delayed pipelines.
The third is grid equipment over turbines. Turbine manufacturers benefit from higher installations, but competition limits pricing power. Cable, transformer, substation, storage, and grid-software suppliers sit closer to the constraint, where demand is rising faster than capacity.
That tilts exposure toward transmission operators, equipment makers, storage firms, and software providers rather than turbine names alone. For diversified access, clean energy ETF are one route, for example, the iShares Global Clean Energy ETF, which spans wind, solar, and related technologies. Utilities exposure can also pair with the theme, since regulated grids, electrification, and transmission spending sit inside the same capital cycle.
European offshore auction pricing: Tests whether new projects can clear higher financing, cable, vessel, and equipment costs.
Transmission capex guidance: Supports grid-equipment exposure if utilities and network operators lift spending plans.
Transformer and cable backlogs: Confirms bottleneck pricing power across the grid supply chain.
Interconnection reform: Improves developer cash-flow visibility by shortening the gap between project approval and revenue.
Interest-rate cuts: Help capital-intensive clean energy assets, but do not remove physical grid constraints.
US offshore policy headlines: Add volatility to offshore developers exposed to lease, permitting, and federal approval risk.
Component cost inflation: Pressures weak project economics when developers have not locked in equipment or construction costs.
Rates remain the macro swing factor. Cheaper money helps capital-heavy clean energy projects, but it does not remove the physical bottleneck. The assets most likely to keep a premium are those that shorten the path from generation to cash flow.
Wind now sits inside a grid repricing cycle. Record installations of 165 GW confirm demand, but more than 2,500 GW of projects in grid queues show that connection capacity decides how much of that demand becomes revenue.
Onshore is better positioned near term after delivering 155.3 GW of the 165 GW installed in 2025. Offshore has the larger long-term prize, but its returns depend more heavily on jurisdiction, policy stability, and supply-chain execution.
Wind capacity only earns when power reaches customers. Transmission delays, curtailment, transformer shortages, and congested queues shift pricing power toward grid equipment, storage, and developers that already hold a connection.
Yes. Clean energy ETFs spread exposure across wind, solar, storage, and related technologies. Instruments such as ICLN.OQ offer thematic access, while utilities exposure through XLU.P can complement the grid infrastructure angle.
The wind industry has largely solved the scale problem. It can build turbines at global scale, with 165 GW added in a single year and 1,299 GW now installed worldwide. The market is now focused on the harder problem between turbine and customer: transmission, transformers, substations, storage, and interconnection.
That is where scarcity sits. In 2026, the wind trade is not only about generating more power. It is about delivering it.