Published on: 2026-07-09
Updated on: 2026-07-09
July has been unusually loyal to the S&P 500. Every July since 2015 has ended higher, turning 2026 into a direct test of an 11-year run. With the index slightly negative early in the month, CPI, yields, and Q2 earnings now decide whether that pattern survives.
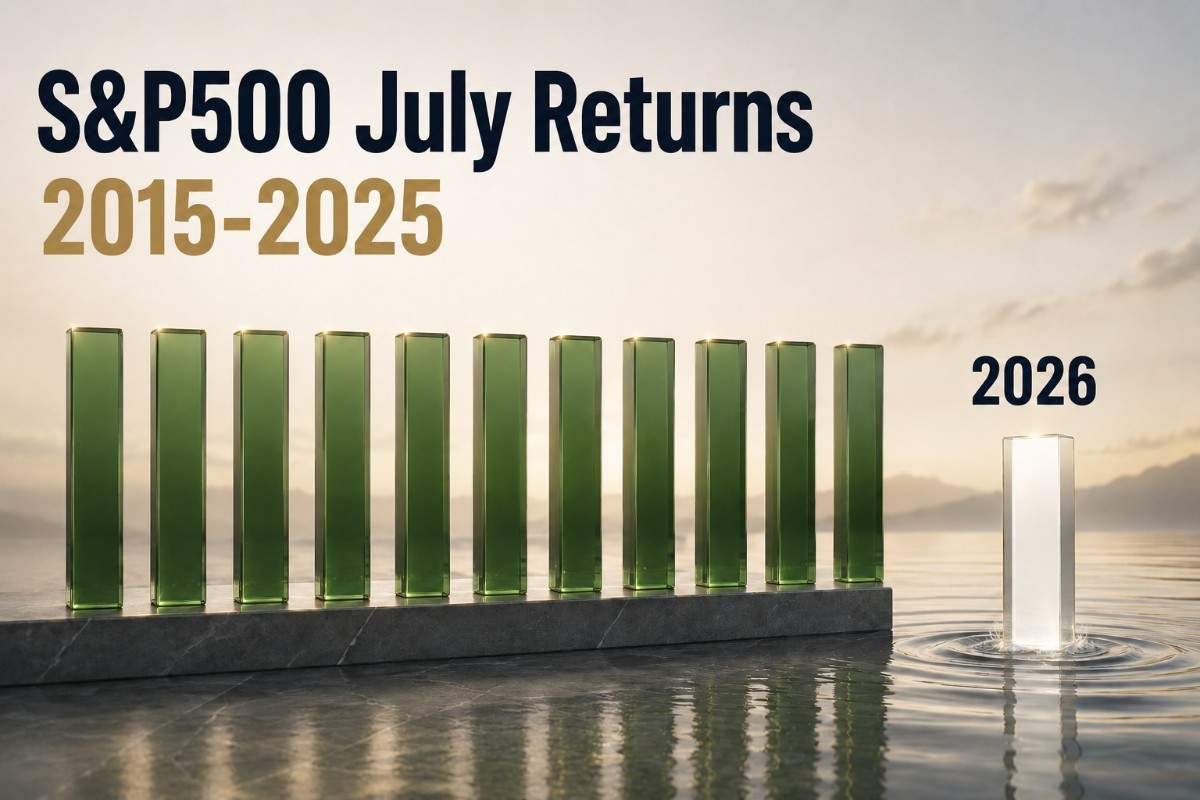
The S&P 500 has risen every July since 2015, putting an 11-year seasonal record on the line in July 2026.
The record is not secure yet, with the index closing July 8 below its June 30 level.
Q2 earnings are the strongest support, with S&P 500 profit growth expected at 23.3% year over year.
Valuation is the pressure point, with the forward P/E at 20.4 versus a 10-year average of 19.0.
July 14 CPI is the first macro trigger that could revive the streak or expose its first break since 2014.
This is more than a seasonal cliché. The S&P 500 finished July higher every year from 2015 through 2025, putting a potential 12th straight July gain on the line in 2026.
| Year | July Return | Read |
|---|---|---|
| 2025 | +2.17% | Streak extended |
| 2024 | +0.9% | Narrow gain |
| 2023 | +3.1% | Strong advance |
| 2022 | +9.1% | Rebound month |
| 2021 | +2.3% | Streak held |
| 2020 | +5.5% | Recovery phase |
| 2019 | +1.3% | Modest gain |
| 2018 | +3.6% | Earnings support |
| 2017 | +1.9% | Low-volatility rise |
| 2016 | +3.6% | Post-Brexit rebound |
| 2015 | +2.0% | Streak began |
The last July break came in 2014, when Argentina’s default, Russia-related sanctions, Portuguese banking stress, weak results, and profit-taking pushed the S&P 500 down about 1.6% for the month.
The 2022 row carries the most weight. July stayed positive even in a bear-market year, so 2026 is not testing whether the pattern exists. It is testing whether valuation risk can finally break it.
The S&P 500 closed June 30 at 7,499.36 and finished July 8 at 7,482.71. That leaves the index down roughly 0.22% for July on a price basis before dividends. The July record is still within reach, but it has not been extended yet.
A close back above 7,499.36 would turn July positive again. The hurdle is small, but the early weakness matters because it strips away the assumption that seasonality can carry the index on its own.
The broader rally also changes the setup. The S&P 500 was up 9.3% on a price basis through July 8. A market already up sharply for the year has less room for a messy inflation print, a yield spike, or weak earnings guidance.
Earnings carry the upside case. The calendar cannot do the work alone.
Q2 S&P 500 earnings are expected to rise 23.3% year over year, which would mark a second straight quarter of earnings growth above 20%. Revenue is expected to rise 12.2%, the strongest growth rate since Q2 2022 if confirmed.
The first earnings test arrives quickly. JPMorgan, Bank of America, and Goldman Sachs report on July 14, followed by Netflix on July 16, giving the month an early read on whether profit strength is broadening beyond the headline estimate.
That is the strongest argument for another positive July. Q2 earnings expectations have climbed from 18.8% at the end of March to 23.3%, so the profit story has improved into reporting season rather than faded.
Guidance strengthens the case. For Q2, 63 S&P 500 companies have issued positive EPS guidance, compared with 48 negative updates. Positive guidance stands at 57%, well above the 5-year and 10-year averages of 41%.
The concentration is the weak point. Information Technology accounts for 44 positive EPS guidance updates, the highest sector count in FactSet data going back to 2006. The streak looks stronger if earnings leadership spreads beyond technology; it looks fragile if one sector carries the index.
The S&P 500’s forward 12-month P/E ratio is 20.4, above its 5-year average of 19.9 and 10-year average of 19.0. The index is not priced for patience. It is priced for confirmation.
That valuation does not block another positive July. It raises the penalty for bad data. A hot CPI print, higher Treasury yields, or weaker guidance can compress multiples even if earnings growth remains positive.
The risk is sharper because price has already moved faster than forward EPS since the end of March. The S&P 500 price index rose 14.6%, while the forward 12-month EPS estimate rose 10.8%. Earnings improved, but price moved faster. At a premium multiple, good results may not be enough unless guidance lifts the next quarter too.
The June CPI report is scheduled for July 14 at 8:30 a.m. ET. May CPI rose 4.2% over the prior 12 months, leaving inflation high enough to keep bond yields sensitive to any upside surprise.
One inflation print can weaken July seasonality faster than 11 years of history can repair. A softer CPI print would reduce pressure on discount rates and give earnings season more room to set the tone. A hotter print would immediately raise the valuation hurdle.
Oil raises the inflation risk at the wrong moment. Brent crude rose 5% above $78 per barrel on July 8 as renewed Iran-related tension hit global markets. Higher oil can lift energy earnings, but it also reopens the inflation channel when the index is already trading at a premium multiple.
Five signals now decide whether July becomes another seasonal win or the first break since 2014.
| Signal | Current Read | What It Means |
|---|---|---|
| July return | About -0.22% | Streak needs a rebound |
| Break-even level | 7,499.36 | Positive July starts above here |
| Q2 earnings | +23.3% expected | Guidance must confirm valuation |
| Forward P/E | 20.4 times | Less room for disappointment |
| CPI | July 14 | First macro test |
The July run survives if CPI stays calm, yields stop rising, and earnings guidance broadens beyond technology. The line is clear: above 7,499.36, July remains positive; below it, the S&P 500 breaks its July winning run for the first time since 2014.
Yes. The S&P 500 finished higher every July from 2015 through 2025, creating an 11-year winning streak. A positive July 2026 would extend the run to 12 years. A negative July would end the run for the first time since 2014.
Through July 8, the S&P 500 was down roughly 0.22% for July on a price basis. The index closed June 30 at 7,499.36 and July 8 at 7,482.71, leaving the month slightly negative but still close to break-even.
Yes, it can, but the bar is not just a positive close. A move above 7,499.36 would keep July’s record intact, while stronger earnings guidance would make the rebound more convincing than a seasonal bounce.
A hotter CPI print, higher Treasury yields, weaker earnings guidance, or narrow leadership concentrated in technology could break the streak. The index does not need a major selloff to end the pattern. A close below 7,499.36 would be enough.
July often benefits from Q2 earnings season, first-half momentum, and fresh positioning after quarter-end. The recent streak has been unusually persistent, which makes July 2026 less about whether the pattern exists and more about whether valuations can still support it.
The July 14 CPI report comes first. Earnings guidance follows with the bigger test: whether the S&P 500 can defend a premium valuation beyond one seasonal month. A July close above 7,499.36 keeps the 11-year run alive. A close below it ends the streak for the first time since 2014.