Published on: 2026-05-05
Updated on: 2026-05-05
The S&P 500 may remain near record highs even as a significant proportion of its constituent stocks experience declining momentum.
The question for traders: who is actually carrying the index?
Market capitalisation weighting enables this divergence. A small number of large companies can elevate the benchmark even when many smaller or weaker constituents are not contributing similarly.
Recent market conditions underscore the importance of monitoring this phenomenon. On 27 April 2026, the S&P 500 and Nasdaq closed slightly higher at the outset of a significant earnings week, as investors also monitored Federal Reserve actions, major technology earnings, US-Iran peace negotiations, and ongoing Middle East tensions.
Market participation has been relatively weak. As of 24 April, only 52.48% of S&P 500 stocks were trading above their 50-day moving average, according to MacroMicro data from S&P Dow Jones Indices. This indicates that the index may appear robust even though nearly half of its constituents are not in short-term uptrends.
The S&P 500 provides an accurate yet incomplete representation of market performance. Market breadth analysis offers additional insight to address this limitation.

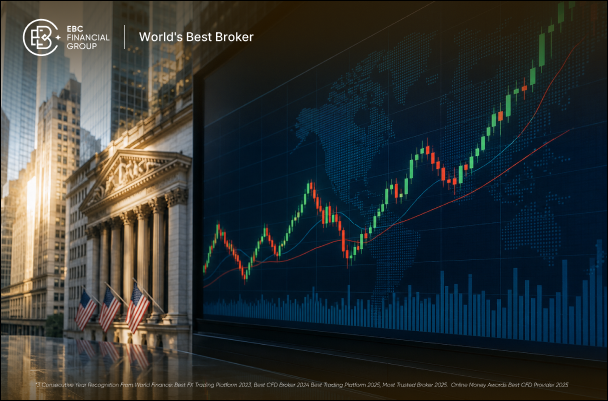
The S&P 500 is among the most closely monitored equity benchmarks globally. It provides a rapid assessment of large-cap US market performance and is frequently regarded as a proxy for the broader market.
However, the index does not assign equal influence to each constituent company.
According to S&P Dow Jones Indices, its US equity indices are weighted by float-adjusted market capitalisation. Larger companies exert greater influence because the index reflects market value, adjusted for shares available to investors.
This structure mirrors the distribution of large-cap market value. A potential misinterpretation arises when investors view a rising S&P 500 as evidence of overall market health.
A limited number of large companies can elevate the benchmark even as many other stocks remain stagnant, underperform, or decline. While the index provides the aggregate outcome, market breadth reveals the underlying distribution of performance.
Market breadth quantifies the degree of participation among constituent stocks in a market movement.
When the S&P 500 increases and most constituent stocks also rise, the rally demonstrates broad support. Conversely, if the S&P 500 rises while many stocks decline, the rally is concentrated among fewer companies.
A widely used breadth indicator is the Advance-Decline Line. Fidelity defines the Advance-Decline Line as a market breadth metric that tracks advancing versus declining stocks through a cumulative total. Fidelity further notes that when an index rises while the Advance-Decline Line declines, fewer stocks contribute to the rally, creating a divergence that may indicate a potential reversal.
The concept is straightforward: a rising index accompanied by an increasing Advance-Decline Line indicates broad participation, whereas a rising index with a declining Advance-Decline Line suggests that fewer stocks are supporting the upward movement.
For traders, breadth serves primarily as a qualitative assessment tool. While it does not offer precise timing signals, it reveals whether a rally is increasingly reliant on a smaller subset of stocks.
It is unnecessary to monitor every internal market indicator. Employing a few practical breadth assessments can enhance the interpretation of S&P 500 movements.
The standard S&P 500 assigns greater influence to larger companies, whereas the equal-weight version allocates identical weight to each constituent at every rebalance.
Comparing these indices provides a clear method for assessing whether the average S&P 500 stock is performing in line with the headline index.
S&P Dow Jones Indices defines the S&P 500 Equal Weight Index as the equal-weight counterpart to the S&P 500. It comprises the same constituents as the capitalisation-weighted index, but each company is assigned 0.2% of the index at each quarterly rebalance.
If the standard S&P 500 outperforms its equal-weighted counterpart, it suggests that larger companies contribute more to index gains. If both indices rise concurrently, the rally is likely more broadly supported.
Equal-weight exposure has gained importance as market concentration increasingly characterises the US equity landscape. CME Group reported in its April 2026 equity recap that traders have increasingly utilised E-mini S&P 500 Equal Weight futures to achieve equal exposure to all S&P 500 constituents, thereby mitigating the influence of market capitalisation.
Another effective breadth assessment involves tracking the percentage of S&P 500 stocks trading above their 50-day or 200-day moving averages.
The 50-day moving average provides a short-term perspective on participation, while the 200-day moving average offers a longer-term assessment of trend strength.
When many stocks are above these levels, the rally has wider support. When the S&P 500 is near record highs, but fewer stocks are above these levels, participation may be weak. The recent figure of 52.48% for S&P 500 stocks above their 50-day moving average contextualises the index’s strength. The benchmark may be near its highs even though a substantial portion of its constituents are not confirming the upward movement.
A rally supported by multiple sectors, such as technology, financials, industrials, consumer discretionary, energy, and small-cap stocks, signals broad market confidence. In contrast, a rally led primarily by technology and semiconductors, while other sectors lag, indicates a more concentrated market.
Factors such as oil prices, interest rates, and geopolitical risk can amplify sectoral disparities. For instance, higher fuel costs may benefit energy-linked companies while adversely affecting transport, airlines, retailers, and other fuel-sensitive businesses. Reuters reported on 28 April that oil prices continued to rise as the US-Iran conflict remained unresolved and the Strait of Hormuz remained largely closed, disrupting global energy supplies.
Market breadth enables analysts to determine whether index gains are driven by a few resilient leaders or supported by a broader range of sectors.
After conducting these assessments, interpretation remains challenging. Narrow leadership may indicate market fragility, but it does not necessarily signal imminent weakness.
A rally characterised by narrow leadership should not be dismissed prematurely.
At times, investors concentrate their holdings in a limited number of stocks due to broader market uncertainty. In such cases, narrow leadership may reflect heightened caution.
In other periods, the largest companies may lead due to superior earnings, higher margins, and more robust growth compared to the broader market. Such rallies can persist longer than weak breadth alone might indicate.
The prominence of technology and semiconductor sectors underscores the importance of this dynamic. Investors are closely monitoring whether major technology earnings can justify the strength already reflected in the index. Reuters reported that Amazon, Alphabet, Meta, Apple, and Microsoft were all included in the significant late-April earnings calendar.
A more pertinent consideration is whether market participation is broadening, narrowing, or remaining overly dependent on a specific segment.
It can indicate whether participation is broad or narrow and whether a rally is strengthening beneath the surface or becoming increasingly reliant on a smaller group of stocks.
However, accurately timing market movements based on breadth remains challenging.
Indicators such as a weak Advance-Decline Line, an underperforming equal-weight index, or a declining proportion of stocks above key moving averages may persist for extended periods before the headline index responds. In some instances, breadth may improve prior to the onset of a major sell-off.
Therefore, market breadth should be analysed in conjunction with earnings, valuations, bond yields, oil prices, central bank guidance, and sector leadership.
The S&P 500 continues to serve as a valuable market indicator, yet the headline index level alone is seldom sufficient for comprehensive analysis.
In a market influenced by technology earnings, oil price fluctuations, central bank policies, and geopolitical risk, it is essential to identify which sectors or companies are driving index movements.
A rally supported by multiple sectors conveys a different message than one driven by a small number of large companies. Market breadth analysis enables early identification of these dynamics before they are reflected in the headline index.