Published on: 2025-06-10
Updated on: 2025-06-10
Hidden divergence is a concept in technical analysis that helps traders predict the continuation of a current trend. Unlike regular divergence, which often signals a reversal, hidden divergence suggests that the existing trend is likely to persist. Recognising hidden divergence can provide traders with valuable insight, allowing them to enter trades with higher confidence in trending markets.
This article will explain what hidden divergence is, how it differs from regular divergence, how traders identify it, and how it can be incorporated into a trading strategy.

To fully grasp hidden divergence, it is important to first understand what divergence means in trading. Divergence occurs when the price of an asset moves in one direction while an indicator, such as the Relative Strength Index (RSI) or Moving Average Convergence Divergence (MACD), moves in the opposite direction. This discrepancy can indicate a potential change in price direction.
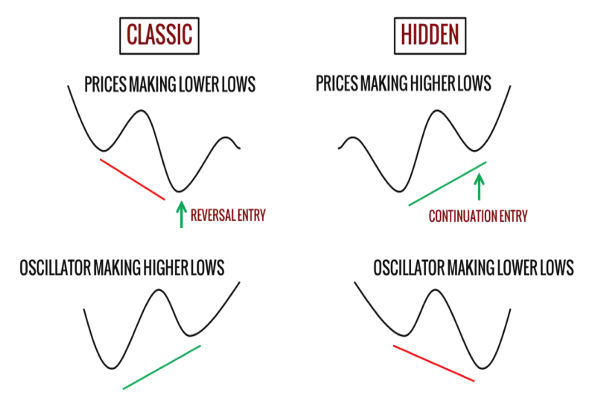
There are two main types of divergence: regular divergence and hidden divergence. Regular divergence typically warns traders of a possible trend reversal, whereas hidden divergence indicates that the trend is more likely to continue.
Hidden divergence appears when the price makes a higher low in an uptrend or a lower high in a downtrend, but the indicator forms a lower low or higher high, respectively. This suggests that the momentum behind the price movement remains strong despite a small retracement or correction.
In an uptrend, hidden bullish divergence occurs when the price forms a higher low, but the indicator forms a lower low. This signals that the underlying trend is still intact and the price is likely to continue rising.
Conversely, in a downtrend, hidden bearish divergence occurs when the price forms a lower high, but the indicator forms a higher high. This suggests that selling pressure remains strong, and the downtrend will likely persist.

Traders often use technical indicators such as the RSI, MACD or stochastic oscillator to spot hidden divergence. The process involves comparing the price action to the movements of these indicators.
For example, in an uptrend, traders look for higher lows in price combined with lower lows in the indicator. This mismatch signals hidden bullish divergence and a potential opportunity to enter or add to a long position.
In a downtrend, traders watch for lower highs in price alongside higher highs in the indicator. This points to hidden bearish divergence, which could be a signal to open or increase a short position.
Identifying hidden divergence requires careful observation and practice, as false signals can occur in volatile or range-bound markets. Using additional confirmation tools such as volume analysis or support and resistance levels can improve accuracy.
Hidden divergence is valuable because it helps traders stay with the trend rather than anticipating a reversal too early. In trending markets, entering a trade during a brief correction can lead to better entry prices and improved risk-reward ratios.
Unlike regular divergence, which warns traders of trend exhaustion, hidden divergence provides confidence that the current trend has strength and is likely to continue. This makes it particularly useful for traders who prefer trend-following strategies.
Moreover, hidden divergence can be used across various markets including forex, stocks, commodities and cryptocurrencies. Its versatility means that traders in different asset classes can benefit from recognising these signals.

Incorporating hidden divergence into a Trading plan typically involves combining it with other indicators and risk management techniques. For example, traders might use hidden divergence alongside moving averages or trendlines to confirm the trend direction.
Entry points based on hidden divergence often coincide with pullbacks or corrections within a trend, allowing traders to enter at more favourable prices. Setting stop-loss orders just below recent swing lows or highs helps manage risk.
It is important to remember that no single indicator guarantees success. Hidden divergence should be one element within a comprehensive trading strategy that includes proper money management and discipline.
While hidden divergence can be a powerful tool, it is not without its limitations. One challenge is that it can produce false signals, especially in markets lacking a clear trend. In such conditions, traders might be misled into entering trades that quickly reverse.
Additionally, hidden divergence is based on technical indicators, which are inherently lagging because they rely on historical price data. Sudden market news or events can override signals generated by hidden divergence.
Because of these factors, traders should always use hidden divergence in conjunction with other analysis methods. Testing strategies in a demo account can help traders gain confidence and avoid costly mistakes.
Hidden divergence is a valuable concept that indicates trend continuation and helps traders make informed decisions in trending markets. By comparing price action to technical indicators, traders can identify opportunities to enter or add to positions during pullbacks.
Its advantage lies in reinforcing the strength of existing trends rather than warning of reversals. However, like any indicator, hidden divergence is not foolproof and should be used alongside other tools and sound risk management.
With practice and careful application, hidden divergence can become a reliable part of a trader’s toolkit, improving both timing and confidence in trade decisions.
Disclaimer: This material is for general information purposes only and is not intended as (and should not be considered to be) financial, investment or other advice on which reliance should be placed. No opinion given in the material constitutes a recommendation by EBC or the author that any particular investment, security, transaction or investment strategy is suitable for any specific person.