Why OTC Markets Contain Persistent Alpha
OTC markets sit outside the polished machinery of major exchanges like the NYSE or NASDAQ. With no centralised order book, fragmented liquidity, and inconsistent reporting standards, price discovery becomes slow, uneven, and exploitable.
This structural inefficiency forms what we call the Alpha Gap—mispricings caused by information lags, local-market fragmentation, and the dominance of Market Makers rather than matching engines.
In the post–T+1 settlement landscape of 2025. traditional "buy and hold" approaches offer diminishing value. The modern OTC specialist operates with a dual framework:
| Strategy Type |
Objective |
When Applied |
| Momentum Scalping |
Exploit short-term liquidity imbalances and technical triggers |
Event-driven bursts, micro-structure setups |
| Fundamental Arbitrage |
Capture mispricing caused by corporate actions or cross-market discrepancies |
Shell mergers, cross-border ADR gaps |
In 2025. success in the OTC ecosystem requires institutional-level precision. Traders must read Level 2 closely, monitor filings, recognise toxic behaviour, and align with the Market Makers who influence price.
Navigating the OTC Market Tiers
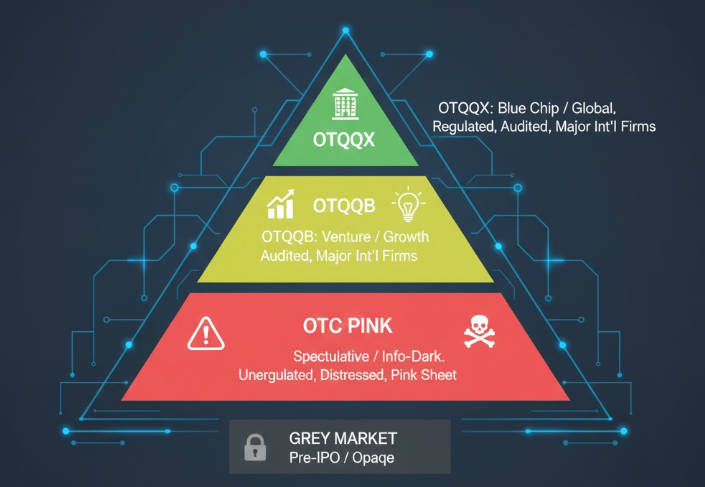
Each OTC tier behaves like an entirely different marketplace. A universal strategy is not just ineffective — it is dangerous. Correct classification is the first step in constructing an effective technical approach.
1. OTCQX — The Premier Institutional Correlate
OTCQX hosts international giants such as Roche and Adidas, alongside high-grade US community banks and established corporates.
Behaviour: These securities behave similarly to large-cap exchange-listed names.
Implication: Traditional technical analysis—RSI, SMA 50/200 crossovers, Fibonacci retracements—works predictably.
Key Insight: Liquidity depth may be thinner, but price movements still reflect institutional order flow rather than manipulation.
2. OTCQB — The Venture-Stage Breakout Arena
OTCQB is populated by early-stage companies with current reporting but limited or inconsistent earnings.
Behaviour: Price movements appear random but are actually dictated by volume concentration.
Technical Edge:
Tactical Goal: Position early before breakout candles form, ideally while Market Makers are absorbing supply.
3. OTC Pink & Grey — The Wildlands of Order-Flow Manipulation
The most unpredictable segment: distressed companies, nearly defunct shells, speculative microcaps, and opaque issuers.
Core OTC Trading Strategy

OTC volatility is not random. Around 80% of major moves come from three recurring structural catalysts. Mastering these setups is essential for consistent performance.
1. Shell Merger (Reverse Merger) Setup
Private companies frequently use dormant public shells to reach the market faster than via IPO.
What You Want:
“Clean Shells” — no debt, minimal assets, intact ticker structure.
Key Signal:
A sudden surge in RVOL > 500% on a stock with no announced news.
Why It Matters:
This almost always indicates early insider accumulation ahead of a merger announcement.
2. Global Arbitrage Pairs — International Pricing Dislocations
Foreign-listed companies (TSX, ASX, LSE) often have a corresponding OTC listing in the US.
The Opportunity:
OTC lags foreign price movements due to lower liquidity and slower arbitrage.
Example:
If a TSX mining stock jumps 10% while the US OTC equivalent remains flat, an eventual catch-up is extremely likely.
Execution:
Buy OTC during lag, exit when parity closes.
3. Toxic Dilution — The High-Probability Short
Distressed OTC issuers often rely on "Variable Rate Convertible Notes," also known as toxic convertibles.
Spotting the Setup:
Filings referencing convertible notes with variable discounts.
How It Works:
Debt holders convert at a discount and dump into the market — a cycle known as the death spiral.
Tactical Approach:
Short into early dilution once Market Makers like VFIN, CDEL dominate the ask.
OTC Advanced Technical Analysis and Market Microstructure
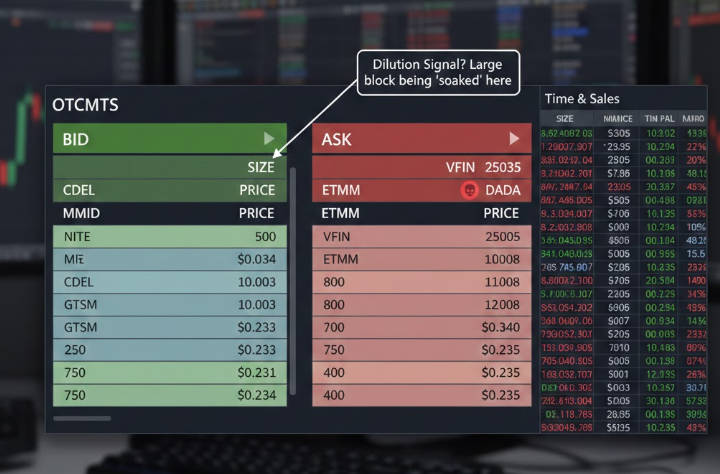
To outperform in OTC markets, charts alone are not enough. You must analyse the Level 2 order book to understand Market Makers' intentions and identify hidden signals.
A. Level 2 Market Maker Micro-Analysis
1. Recognising MMIDs and Their Behaviours
Every bid or ask quote is tagged with a Market Maker ID:
Wholesalers: NITE, CDEL
When they refresh the ask repeatedly → Dilution Signal.
Proprietary Diluters: VFIN
Heavy presence on the ask side = toxic conversion selling.
2. Identifying "The Ax"
The Ax is the Market Maker controlling price behaviour.
They appear constantly on both bid and ask.
They "set the box" — the day's effective price range.
Rule:
Trade in the same direction as the Ax; never trade against them.
B. Volume Intelligence — The Truth Hidden Behind the Candles
1. Anchored VWAP for Institutional Footprint Detection
Institutions use VWAP-based algorithms to accumulate shares without moving the price.
2. Accumulation/Distribution (A/D) Divergence
During consolidation:
C. OTC-Exclusive Chart Patterns
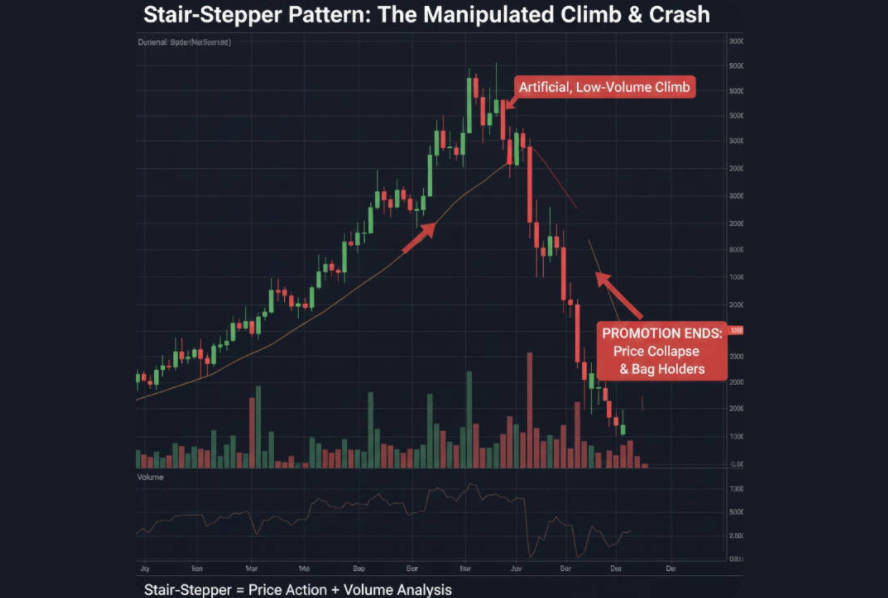
The "Stair-Stepper" Pattern (Bearish)
Characterised by perfectly incremental rises over several days with thin volume.
OTC Algorithmic Footprints and Execution Precision
1. Identifying Algo Lines
HFTs paint false liquidity by firing tiny odd-lot trades (100–200 shares) within a narrow micro-range.
2. Bid-Whacking — The Professional Entry
Market orders are suicidal in OTC due to instant price gaps.
Technique:
Set low limit buys below the current bid during panic flushes.
Why It Works:
Retail traders using market sells can crash price, filling your low bid before an immediate snapback.
Quantitative Risk Management in the OTC Landscape
Risk in OTC markets compounds faster than in large-cap equities. Proper mathematical discipline is the difference between longevity and ruin.
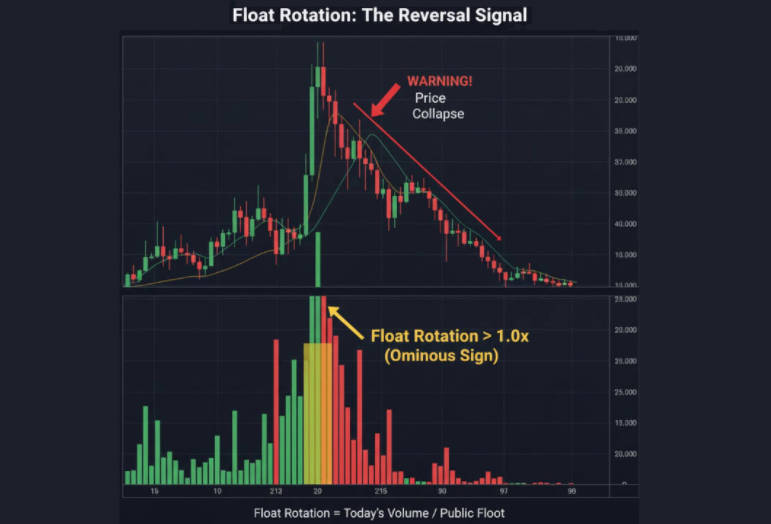
1. Float Rotation Analysis
A crucial overheating indicator:

Interpretation:
| Float Rotation |
Meaning |
Implication |
| < 0.5 |
Moderate activity |
Healthy movement |
| 0.5–1.0 |
Elevated turnover |
Caution warranted |
| > 1.0 |
Overheated |
High risk of reversal |
If the entire float rotates in one day, probability of reversal skyrockets.
2. Liquidity-Based Position Sizing
Position size must not depend on account size — only liquidity.
3. Navigating T+1 Settlement Traps
With T+1, capital frees faster but Good Faith Violations (GFVs) are harsher.
Buying with unsettled funds means you cannot sell until settlement.
In fast-moving OTC names, being unable to exit for 24 hours can cause catastrophic losses.
Frequently Asked Questions (FAQ)
Q1: Why doesn't my limit order fill even though the price touched it?
OTC has no single matching engine. Your order must be accepted by the Market Maker holding inventory. If they refuse, you will not fill.
Q2: What is Caveat Emptor (CE)?
A regulatory warning label indicating fraud, promotion, or investigation risk. Brokers often restrict trading immediately. Treat as a "Do Not Touch."
Q3: Should I use Stop Loss orders?
Extremely risky. OTC gaps can open 20–40% lower, triggering stops at the lowest price. Use mental stops + hard limit orders.
Q4: How do I identify front-loading?
Look for sharp volume spikes with no price movement days before promotional campaigns. Insiders accumulate ahead of promotion.
Conclusion
Success in OTC trading doesn't come from hype, luck, or chasing the next "runner." It comes from systematic, repeatable, and data-driven discipline.
A real edge is built on three foundations:
Microstructure Mastery:
reading Level 2 as a behavioural map of Market Makers, hidden liquidity, and real order-flow intentions.
Dilution Intelligence:
dissecting filings, identifying toxic funding structures, and forecasting supply before it hits the market.
Liquidity Engineering:
understanding float behaviour, rotation cycles, and execution boundaries that separate high-probability setups from traps.
Indicators show what has happened. Order-flow shows what is happening.But the elite OTC specialist combines both with forensic analysis to anticipate what will happen next.
Disclaimer: This material is for general information purposes only and is not intended as (and should not be considered to be) financial, investment or other advice on which reliance should be placed. No opinion given in the material constitutes a recommendation by EBC or the author that any particular investment, security, transaction or investment strategy is suitable for any specific person.
