Published on: 2025-06-04
Updated on: 2025-06-04
In the fast-paced world of technical analysis, indicators often battle for relevance. But one tool has managed to stand the test of time — the stochastic oscillator. It remains a favourite among traders for its ability to pinpoint potential turning points in market momentum, providing insights that other indicators often miss.
If you are new to chart reading or looking to refine your approach to short-term signals, understanding how the stochastic oscillator works can offer an edge in spotting trends before the crowd reacts.

Developed by George Lane in the late 1950s, the stochastic oscillator is a momentum indicator designed to show where a current price sits relative to its recent price range over a specified period. It operates on the principle that prices tend to close near their highs in uptrends and near their lows in downtrends.
It compares the most recent closing price to the range of prices over a given time frame, typically 14 periods. The output is a percentage-based value that moves between 0 and 100, making it easy to interpret and visually track.
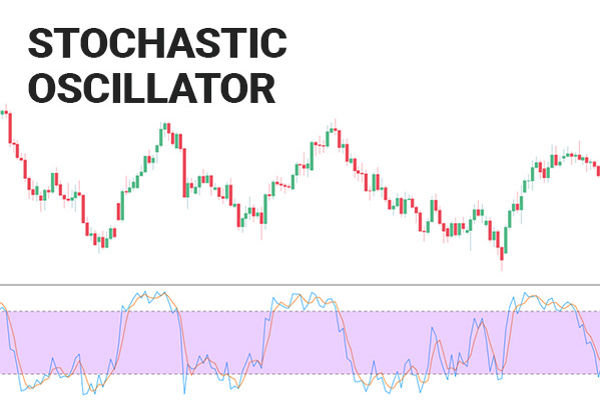
The stochastic oscillator is built from two main lines:
%K line: The primary line, calculated from price data
%D line: A moving average of the %K line, used to smooth out noise
When these lines cross over or move into overbought and oversold zones, they can offer potential signals to buy or sell.
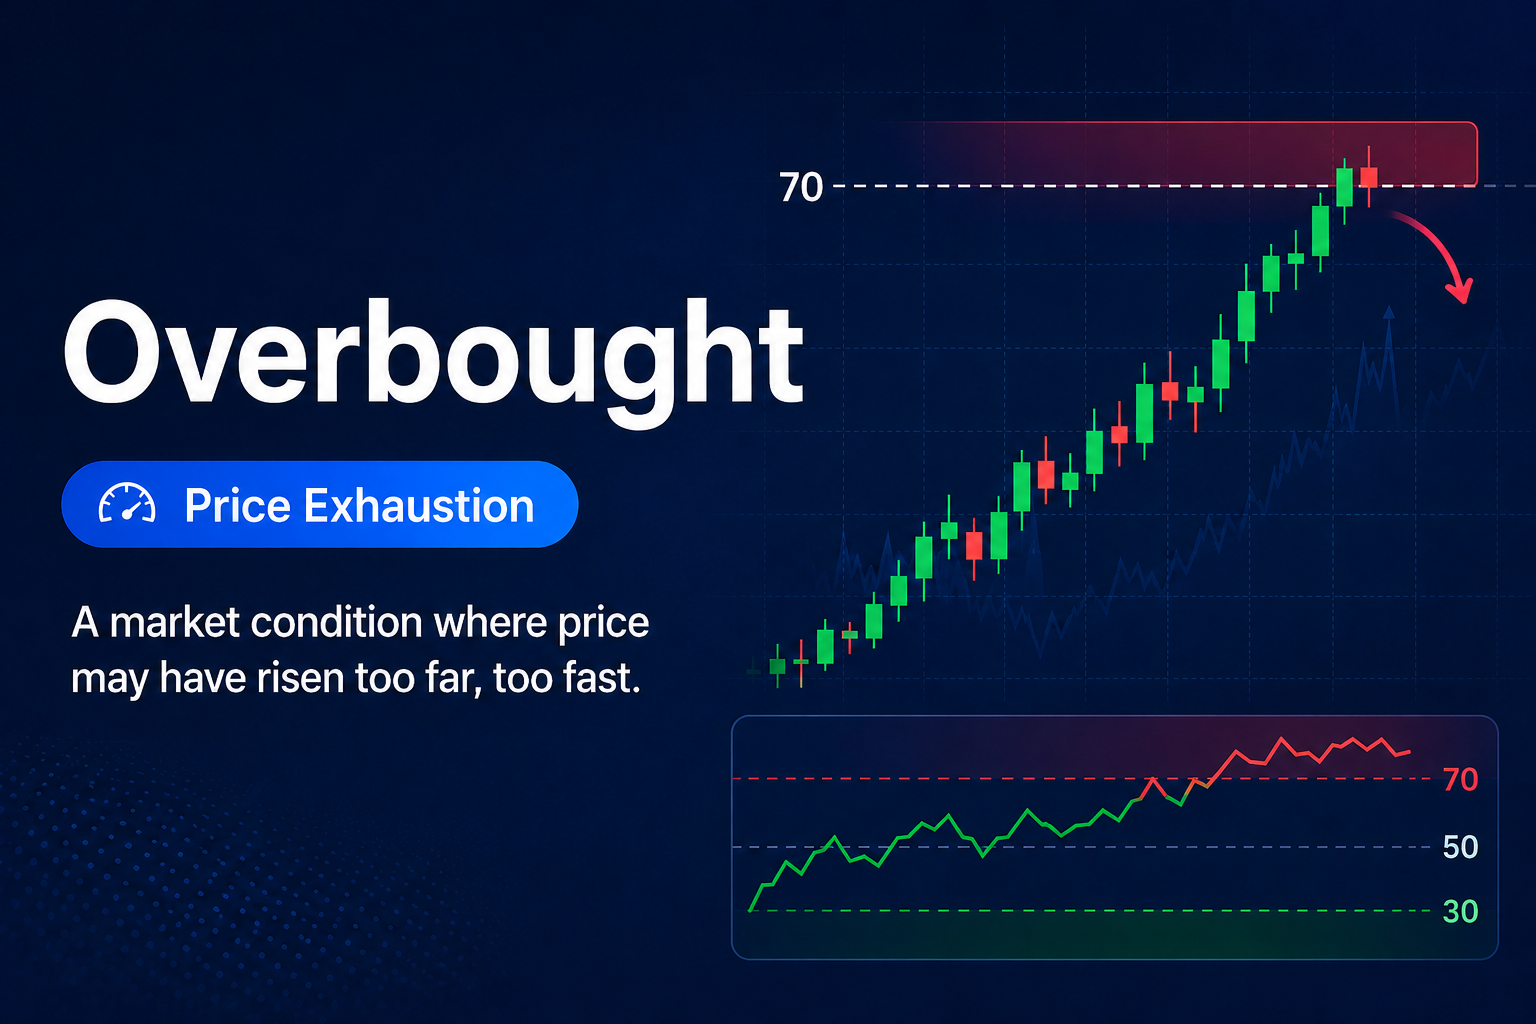
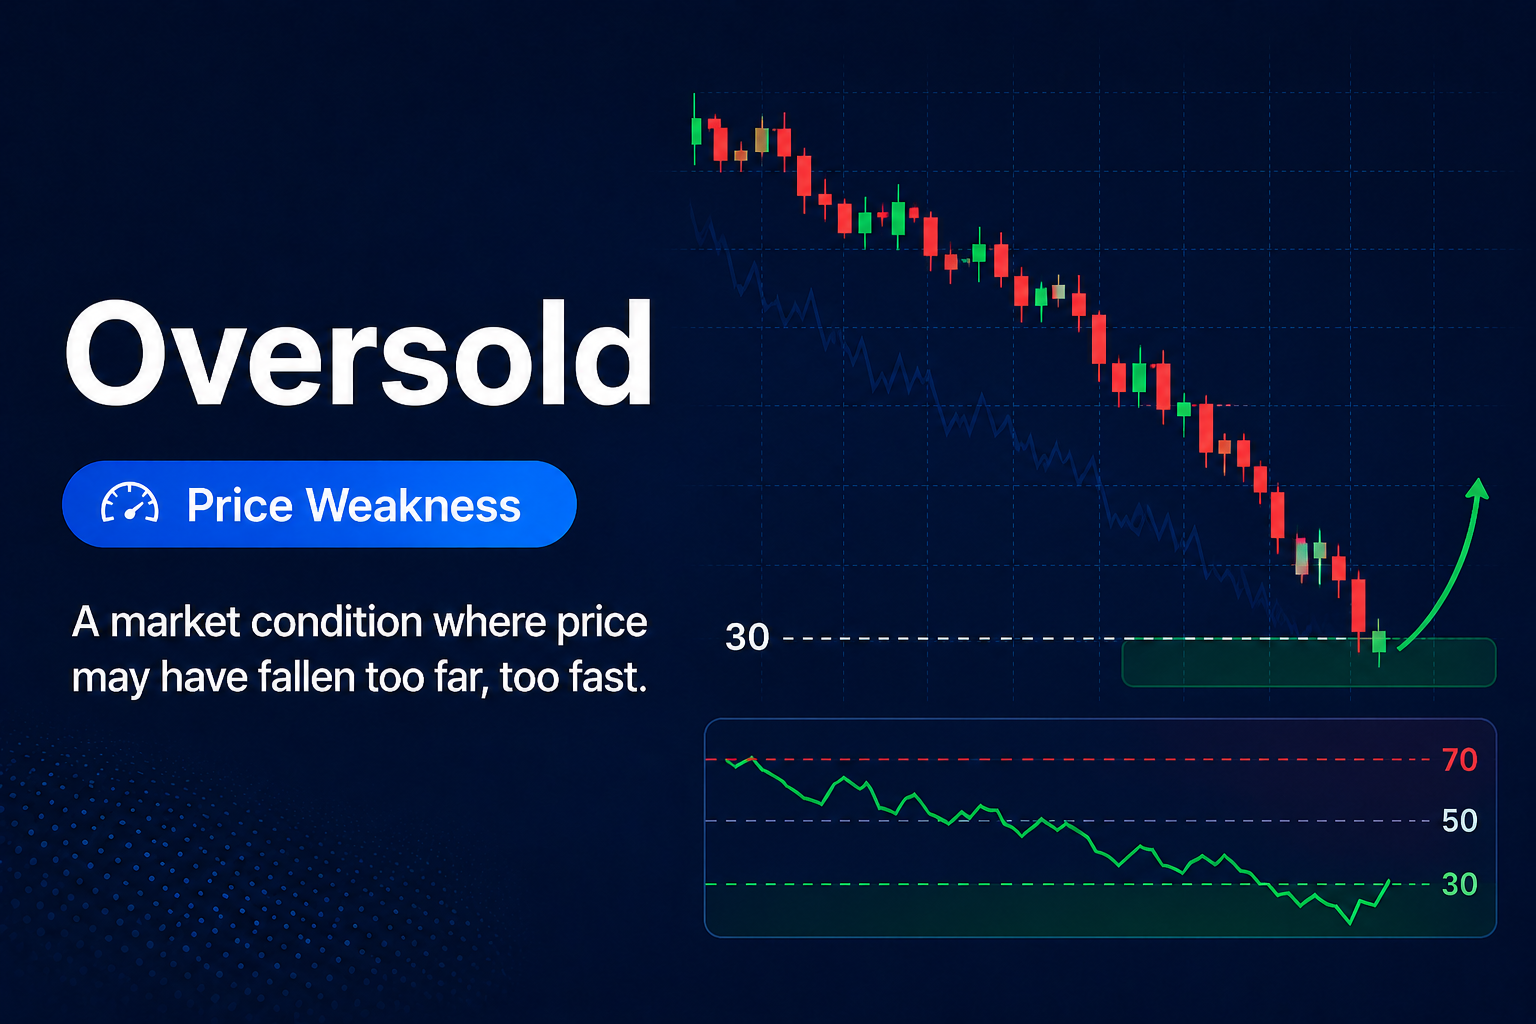
Overbought is typically defined as levels above 80, while oversold is considered anything below 20. These zones signal that a market may be stretched and due for a reversal — though it's never wise to rely on them alone.
Imagine a currency pair trading between 1.1000 and 1.1200 over the past two weeks. If the latest closing price is at 1.1180, the stochastic oscillator will produce a high reading, indicating strong momentum near the top of the range.
On the other hand, a close near 1.1020 would suggest weakness, signalling traders that the asset is closing near the bottom of its range. These readings can be especially useful for identifying turning points, particularly when the %K and %D lines begin to diverge from price action.

The stochastic oscillator is widely used in three main ways:
1. Overbought and Oversold Levels
When the indicator moves above 80 or below 20, traders often look for potential reversals. However, it is crucial to understand that these are signals of potential, not confirmation. Markets can remain overbought or oversold for long periods, especially during strong trends.
2. Signal Line Crossovers
When the %K line crosses above the %D line in the oversold area, it can indicate a buy signal. Likewise, a cross below in the overbought zone can be seen as a sell signal. These crossovers help traders confirm that momentum is shifting.
3. Divergence from Price
If the price is making new highs but the oscillator is not, this divergence can hint at weakening momentum. A similar logic applies when prices make new lows but the oscillator fails to follow — it could be a warning of a potential rebound.
The stochastic oscillator shines in ranging markets, where it becomes easier to identify reversals at support and resistance levels. For example, in a sideways market, spotting a crossover at the lower range near 20 can provide early entry points before a move upward.
However, in strongly trending markets, this indicator can produce false signals. A market that continues to climb will naturally stay in the overbought zone. In such cases, relying solely on the stochastic oscillator can lead to mistimed trades. To avoid this, many traders use it in conjunction with other tools, such as trendlines, moving averages, or volume indicators.
Its popularity among traders comes down to three things:
Clarity: With values between 0 and 100, interpretation is simple
Versatility: It can be used across timeframes and asset classes
Early signals: It often shows reversals before they play out fully in price
This is why the stochastic oscillator remains a core part of many trading strategies. It is especially useful for short-term traders looking for precision and timing in entries and exits.
Despite its simplicity, the stochastic oscillator is not foolproof. Traders often make avoidable errors, such as:
Taking every overbought or oversold signal at face value
Ignoring the broader market trend
Using the oscillator without confirming with other indicators
Combining it with trend analysis or price action context greatly increases its reliability.
The stochastic oscillator continues to earn its place on trader screens for good reason. Whether you are spotting a divergence, acting on a crossover, or timing a potential reversal, this tool can help add structure and discipline to your trading decisions.
That said, like all indicators, it is most powerful when used with broader analysis. No single tool holds all the answers, but the stochastic oscillator, when applied wisely, can offer signals that are both timely and powerful.
Disclaimer: This material is for general information purposes only and is not intended as (and should not be considered to be) financial, investment or other advice on which reliance should be placed. No opinion given in the material constitutes a recommendation by EBC or the author that any particular investment, security, transaction or investment strategy is suitable for any specific person.