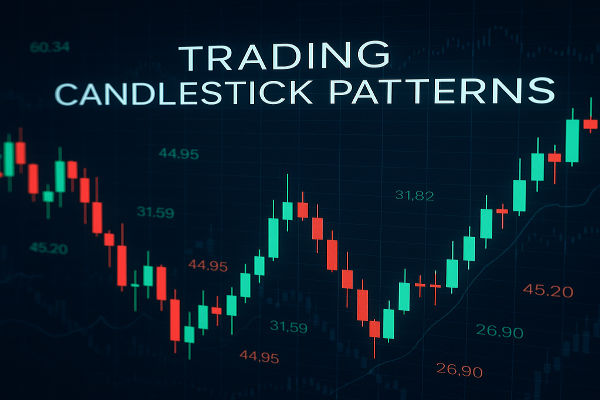
Candlestick patterns remain one of the most powerful tools in a trader's arsenal. Even as AI-driven trading and algorithms dominate in 2025, candlestick charts still reveal raw market psychology in real time, something no code can fully replicate.
By analysing candlestick formations, traders can quickly spot whether buyers or sellers dominate, recognise possible reversals, or validate existing trends.
In this guide, we'll cover the Top 20 trading candlestick patterns every trader should know in 2025, with clear explanations, examples, and insights on how to use them in real-world trading.
What Are Trading Candlestick Patterns?
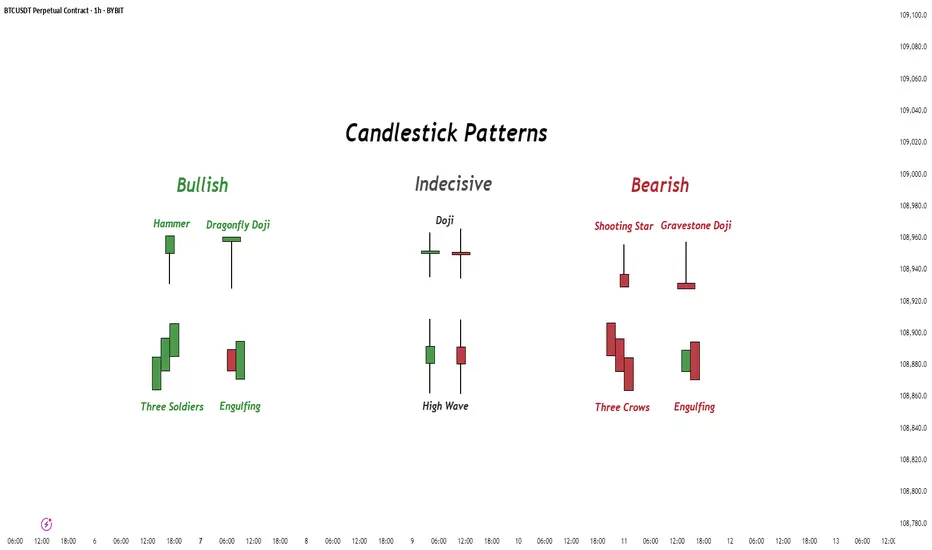
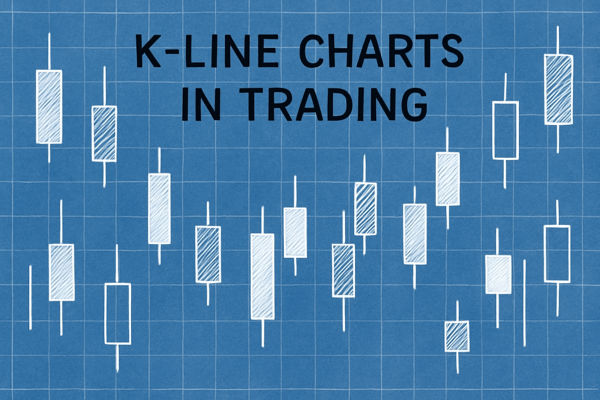
Candlestick patterns are chart formations made up of one or more candlesticks that show price action within a specific time frame. Each candlestick represents four key data points:
Open price
Close price
High price
Low price
When multiple candlesticks form recognisable patterns, they signal potential reversals, continuations, or indecision in the market.
Understanding candlestick patterns is crucial because they:
Reveal the psychology of buyers and sellers in real time.
Help traders identify entry and exit points.
Work across stocks, Forex, commodities, and crypto.
Provide high-probability setups when combined with RSI, MACD, or moving averages.
Top 20 Trading Candlestick Patterns to Master in 2025
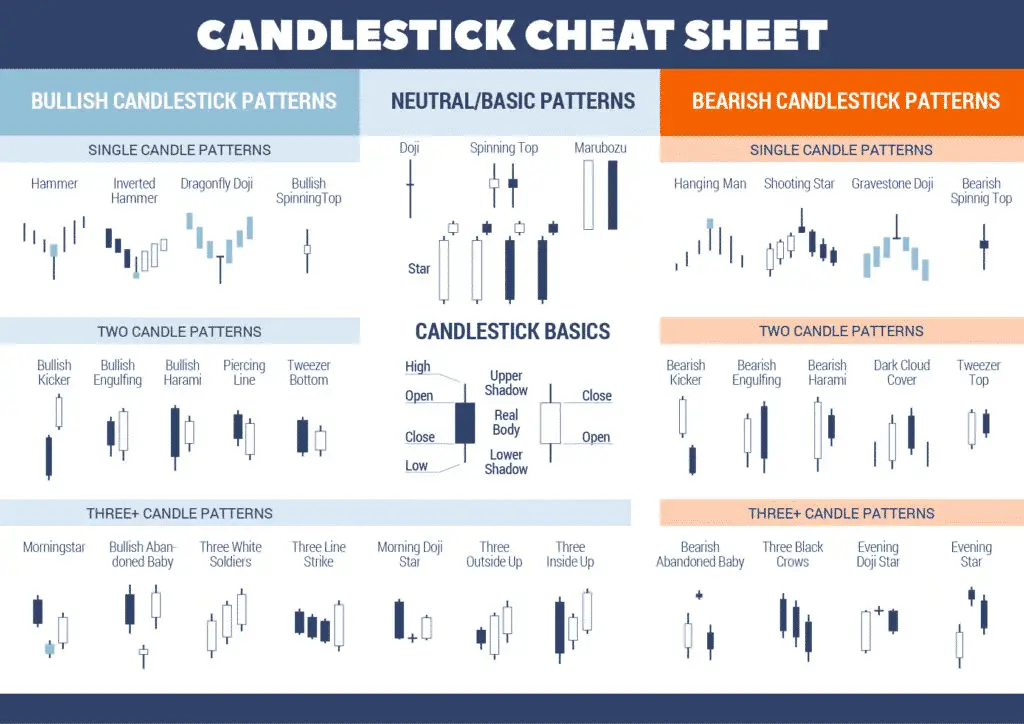
Candlestick patterns fall broadly into three categories: Bullish (reversal or continuation of upward moves), Bearish (reversal or continuation of downward moves), and Neutral (indecision or transition signals).
8 Bullish Candlestick Patterns to Know
1. Hammer Pattern (Bullish Reversal)
A hammer appears after a downtrend. It has a small body and a long lower shadow, indicating buyers are stepping in after heavy selling pressure.
2. Inverted Hammer Pattern
Similar to the hammer but with a long upper wick. Found at the end of a downtrend, it shows buyers attempted to push the price up.
3. Bullish Engulfing Pattern
Occurs when a small red candle is followed by a large green candle that fully engulfs it.
4. Piercing Pattern
A two-candle bullish reversal where the second candle opens lower but closes above the midpoint of the first bearish candle.
5. Morning Star Pattern
A three-candle pattern: one bearish candle, one small indecisive candle, and a strong bullish candle.
6. Three White Soldiers Pattern
Three consecutive long green candles that open within the previous candle's body and close higher.
Meaning: Strong bullish momentum.
Tip: Confirm with RSI to avoid overbought traps
Caution: Exercise caution, since a high RSI might indicate overbought conditions.
7. Dragonfly Doji
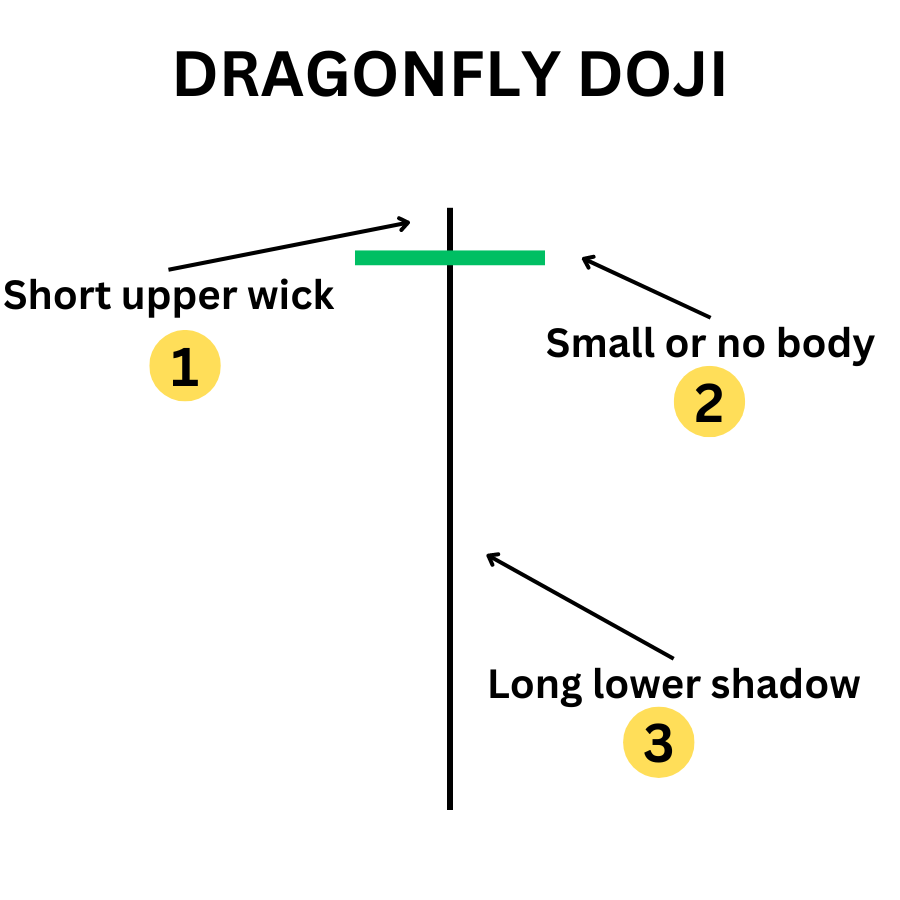
A single candle with a long lower shadow and almost no body. Appears after a decline.
8. Tweezer Bottoms
Two candles with the same low price at the bottom of a downtrend.
8 Bearish Candlestick Patterns Traders Must Master
9. Gravestone Doji
Opposite of the dragonfly doji, with a long upper wick and little to no body. Appears after an uptrend.
10. Bearish Engulfing Pattern
A bearish reversal where a green candle is followed by a large red candle that engulfs it.
11. Dark Cloud Cover Pattern
A bearish reversal pattern where the second candle opens higher but closes below the midpoint of the previous green candle.
12. Evening Star Pattern
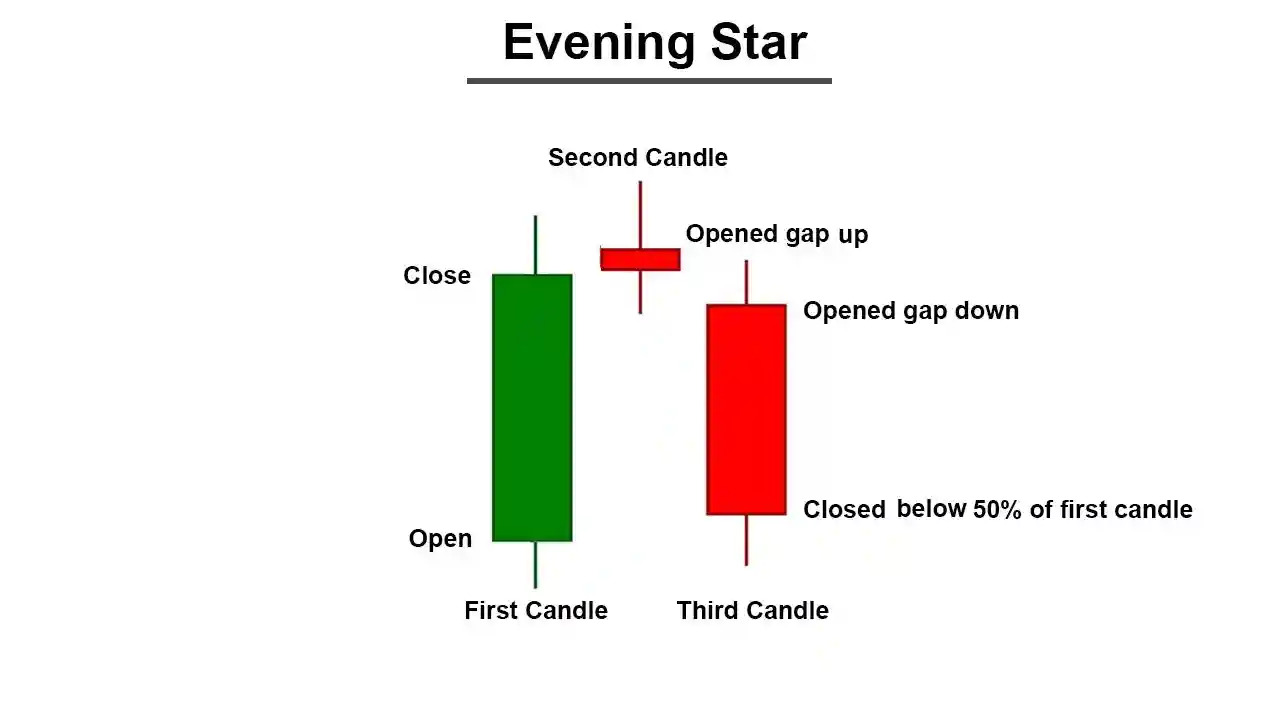
The bearish counterpart of the Morning Star. Three candles: a bullish candle, a small indecisive candle, and a bearish candle.
13. Shooting Star Pattern
A single candle with a small body and long upper wick, appearing at the end of an uptrend.
14. Hanging Man Pattern
Looks like a hammer but appears at the top of an uptrend.
15. Tweezer Tops
Two candles with the same high price at the top of an uptrend.
16. Three Black Crows Pattern
Three consecutive long red candles that open within the previous candle's body and close lower.
Meaning: Strong bearish momentum.
Caution: It may suggest oversold conditions. Thus, confirm with volume or RSI.
What Are the 4 Neutral Candlestick Patterns to Know?
17. Doji
A candle where open and close prices are nearly identical, showing indecision.
Meaning: Market balance between bulls and bears.
Types: Dragonfly, Gravestone, and Long-legged.
Caution: Usually neutral, but context matters.
18. Spinning Top Pattern
A small body with long upper and lower shadows, showing indecision.
19. Harami Pattern (Bullish & Bearish)
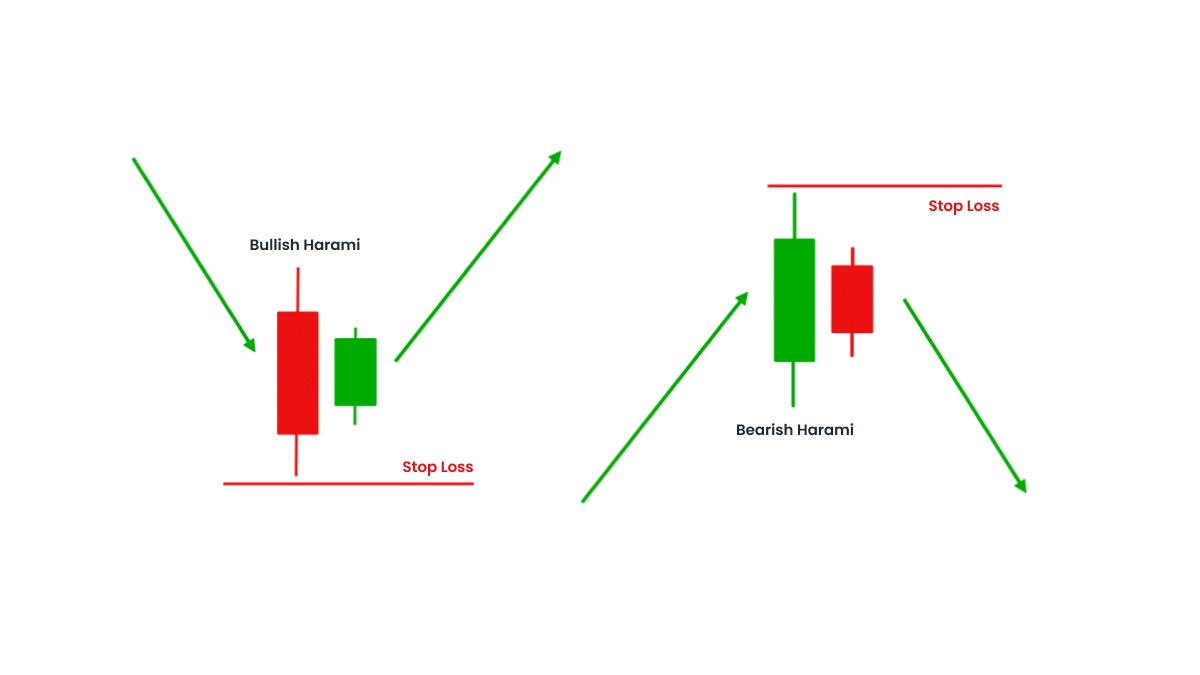
A small candle inside the body of the previous larger candle.
Bullish Harami: Appears in a downtrend, suggesting a reversal.
Bearish Harami: Appears in an uptrend, suggesting a reversal.
20. Marubozu
A candle with no shadows (only body). A green Marubozu indicates robust buying, while a red one signifies vigorous selling.
How to Trade Using Candlestick Patterns
Candlestick patterns are powerful since they represent trader psychology. Each wick and body tells a story of buyers and sellers competing for control. By mastering these 20 candlestick patterns, traders gain insights into momentum, reversals, and continuation signals.
However, simply memorising candlestick patterns is not enough. To use them effectively:
Combine with Support and Resistance: Patterns near key levels are stronger.
Look for Volume Confirmation: Higher volume increases reliability.
Use in Confluence with Indicators: RSI, MACD, and moving averages can validate signals.
Always Manage Risk: Place stop-loss orders to protect against false signals.
Frequently Asked Questions
1. What Are Candlestick Patterns in Trading?
Candlestick patterns are visual price formations on a chart that represent market sentiment and potential future movements based on the relationship between open, high, low, and close prices of an asset.
2. Which Trading Candlestick Pattern Is the Most Reliable for Beginners?
The Hammer and Bullish Engulfing patterns are some of the most dependable candlestick formations for newcomers, as they are simple to spot and deliver distinct bullish reversal indicators.
3. Are Candlestick Patterns Effective in Forex Trading?
Yes, candlestick patterns are widely used in forex trading because they provide insights into market psychology and short-term price movements, making them crucial for intraday and swing traders.
4. Which Candlestick Pattern Is Most Profitable?
No pattern guarantees profits, but Morning Star, Bullish Engulfing, and Three Black Crows are among the most reliable when confirmed.
Conclusion
In conclusion, candlestick patterns are timeless tools that help traders analyse markets visually and make better decisions. Whether you trade stocks, Forex, or crypto, learning these Top 20 candlestick patterns will give you a significant edge.
However, keep in mind that candlestick patterns are not independent strategies. They work best when combined with trend analysis, technical indicators, and risk management.
Disclaimer: This material is for general information purposes only and is not intended as (and should not be considered to be) financial, investment or other advice on which reliance should be placed. No opinion given in the material constitutes a recommendation by EBC or the author that any particular investment, security, transaction or investment strategy is suitable for any specific person.
