Published on: 2025-04-16
Updated on: 2025-10-23
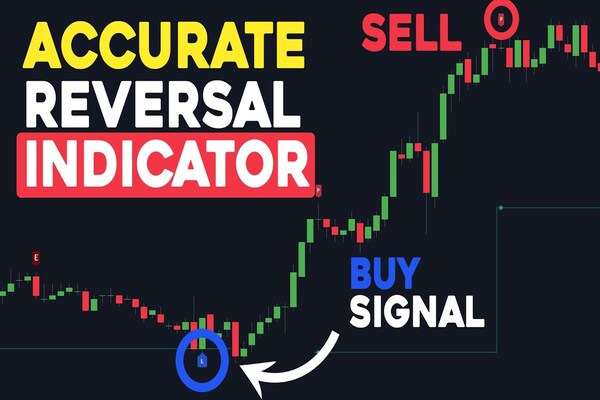
In fast-moving financial markets, spotting a trend reversal before it happens gives traders a decisive edge. Reversal indicators help identify when momentum is fading, guiding timely entries and exits that protect profits and reduce risk.
Whether you're trading stocks, forex, or commodities, understanding how to use reversal indicators can greatly enhance your trading strategy.

A reversal indicator is a technical analysis tool designed to signal a potential change in market direction. Instead of following a trend, reversal indicators help traders detect when bullish momentum is weakening or when bearish momentum may be bottoming out.
These indicators work by identifying shifts in price behavior, momentum, or market sentiment, a warning that a prevailing trend could be losing strength. They appear in various forms, such as oscillators, chart patterns, and candlestick signals.
Spotting reversals early is key to managing risk and maximizing returns. Reversal indicators help traders identify when a trend is losing strength, allowing them to:
Enter new trends at the right moment
Exit positions before losses escalate
Filter out false breakouts or misleading signals
Base decisions on objective data instead of emotion
By grounding their strategy in technical evidence, traders build greater consistency, discipline, and confidence that define long-term success in any market.
Reversal indicators come in many forms, each designed to reveal subtle shifts in market momentum before a new trend takes hold. Some rely on mathematical formulas, while others stem from price patterns or trader psychology.

The RSI measures the speed and magnitude of price changes. Values above 70 suggest an overbought market where a bearish reversal might occur while readings below 30 suggest oversold conditions and possible bullish reversal.
Divergences between RSI and price movement often serve as early warning signs of trend exhaustion.
The MACD tracks the relationship between two moving averages. A bullish reversal occurs when the MACD line crosses above the signal line, and a bearish reversal forms when it crosses below.
When price moves in one direction but MACD in another, this further strengthens the reversal evidence.
The Stochastic Oscillator compares the closing price to its recent range. Readings above 80 may indicate overbought conditions, while readings below 20 suggest oversold.
When the %K line crosses below the %D line in the overbought zone, a bearish reversal may be near, and vice versa.
Candlestick patterns are among the most widely used reversal indicators because they visually capture the battle between buyers and sellers in a single price bar.

Traders commonly monitor formations like the hammer, doji, engulfing, and shooting star, each signaling shifts in market sentiment.
While results vary by context, studies and trader experience often point to engulfing and hammer patterns as among the most reliable, especially when confirmed by volume or support-resistance levels.
Chart structures also reveal trend reversals.
Head and Shoulders: Bearish reversal pattern after an uptrend.
Double Top / Double Bottom: Signal exhaustion and potential reversal points.
Rounding Bottom: Gradual shift from bearish to bullish sentiment.
Volume often confirms whether a reversal is genuine. A price move accompanied by a strong increase in volume suggests conviction behind the new direction. Without it, the reversal could be weak or short-lived.
Like all technical tools, reversal indicators offer both advantages and limitations.
| Pros | Cons |
|---|---|
| Allow early identification of trend changes | Can produce false signals in volatile markets |
| Improve entry and exit timing | Require confirmation from multiple indicators |
| Enhance profitability when used with discipline | Less effective in strong, trending markets |
Their effectiveness depends on how they’re applied, the trader’s experience, and prevailing market conditions.
No single indicator is reliable in isolation. Traders often combine RSI, MACD, and chart or candlestick signals for confirmation before acting on reversal cues.
Divergence occurs when price movement and an indicator move in opposite directions, often a precursor to trend reversal. For example, prices making higher highs while RSI makes lower highs can signal weakening buying pressure.
Reversals gain credibility when supported by key price levels. A break below strong support following multiple bearish signals provides stronger evidence of a downtrend forming.
Reversal trades can offer high reward potential but come with increased risk. Using stop-loss orders and proper position sizing ensures capital protection if the signal proves false.
Let’s say a stock has been climbing steadily for several weeks. The RSI moves above 70, showing that the stock may be overbought and losing strength.
Around the same time, a bearish engulfing candlestick appears near a resistance level, a common warning that buyers are running out of momentum. Finally, the MACD line crosses below the signal line, confirming that momentum is shifting to the downside.
When all these signs align, traders often take it as a cue to lock in profits or prepare for a possible downward move.

Even the best setups can fail if traders misread signals or act prematurely. Recognising these common mistakes helps improve timing, risk control, and overall strategy discipline.
Acting too early without confirmation – Entering before signals align often leads to false reversals. Always wait for clear confirmation through price action or volume.
Ignoring macro or news catalysts – Technical reversals can be overridden by economic data or major news events. Always factor in market context.
Using only one indicator – No single tool is fully reliable. Combine multiple reversal signals to validate entry or exit points.
Neglecting stop-loss placement – Reversal trades carry higher uncertainty. Setting precise stop levels protects against sudden market swings.
Avoiding these errors helps traders stay objective, protect capital, and increase the reliability of reversal-based strategies.
No single indicator is foolproof, but traders often rely on RSI, MACD, and candlestick patterns together for confirmation. Engulfing and hammer patterns tend to perform best when combined with momentum indicators and volume analysis.
Confirmation comes when multiple indicators align and price breaks key support or resistance levels. A change in volume or a divergence between price and momentum indicators adds further credibility.
Yes. Reversal indicators work across stocks, forex, commodities, and crypto, though parameters and volatility levels may differ by asset class. Always adjust timeframes and thresholds to suit the market’s behavior.
Reversal indicators remain essential tools for identifying when market momentum is shifting. By combining technical signals such as RSI, MACD, and candlestick formations, traders can recognise potential turning points before they fully unfold.
This approach helps refine trade entries, protect profits, and strengthen overall risk control.
However, no indicator guarantees accuracy. Effective reversal trading depends on confirmation, discipline, and proper risk management.
When used within a broader strategy that includes volume, trend analysis, and clear stop-loss placement, reversal indicators can become a cornerstone of a trader’s decision-making framework.
Disclaimer: This material is for general information purposes only and is not intended as (and should not be considered to be) financial, investment or other advice on which reliance should be placed. No opinion given in the material constitutes a recommendation by EBC or the author that any particular investment, security, transaction or investment strategy is suitable for any specific person.