Published on: 2025-09-12
Updated on: 2025-09-12
Fast and flexible, the 9 EMA helps crypto and forex traders spot momentum shifts, time trades precisely, and manage risk effectively.
Favoured by day traders, swing traders, and scalpers, the 9 EMA combines speed, simplicity, and reliability, making it one of the most popular short-term moving averages in modern trading.
This article explores the mechanics, strategies, advantages, limitations, and practical applications of the 9 EMA for crypto and forex trading.
The 9 EMA is a responsive tool that helps traders track momentum and trends.
It is most effective in trending markets and less reliable in sideways conditions.
Traders achieve better results when they combine it with other indicators and multi-timeframe analysis.
The 9 EMA enhances trading decisions but should never replace proper risk management.

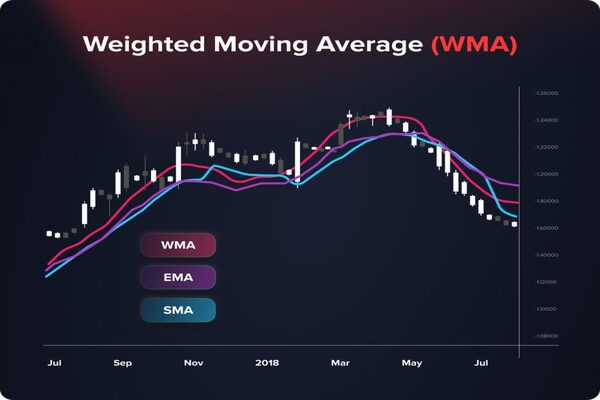
The 9 EMA is a type of Exponential Moving Average calculated over nine periods. Unlike a Simple Moving Average (SMA), which treats all periods equally, the EMA gives greater weight to recent price movements, making it highly responsive to short-term market changes.
Short-term focus: The 9-period span allows traders to react quickly to momentum shifts.
Trend confirmation: Price relative to the 9 EMA indicates bullish or bearish short-term trends.
Visual simplicity: On charts, it creates a smooth line that highlights market direction without clutter.
In short, the 9 EMA provides traders with a fast and visual way to measure short-term market sentiment.
The 9 EMA is computed using a weighted formula:
Calculate the initial SMA for the first nine periods.
Determine the weighting multiplier: 2 ÷ (9 + 1) = 0.2.
Apply the multiplier to the most recent price, then smooth forward by including previous EMA values.
Most trading platforms handle the calculation automatically, but understanding this formula helps traders grasp why the 9 EMA reacts more quickly than longer moving averages.
The 9 EMA serves multiple functions for professional traders:
Trend Identification – Price above the 9 EMA signals short-term bullish momentum; price below signals bearish momentum.
Entry and Exit Signals – Crossovers with price or longer EMAs can generate actionable trade ideas.
Dynamic Support and Resistance – In trending markets, the 9 EMA often acts as a moving support or resistance line.
Momentum Measurement – A steeply rising or falling 9 EMA signals strong momentum, helping traders ride trends efficiently.

When price crosses above the 9 EMA, traders may consider a long entry, assuming momentum is building.
Conversely, crossing below the EMA can indicate a shorting opportunity or exit from long positions.
Pair the 9 EMA with a longer EMA (20 or 50 periods).
A 9/20 crossover often signals a trend change, with the shorter EMA moving above indicating bullish momentum.
Check the 9 EMA across different timeframes (e.g., 15-min, 1-hour, daily) to confirm the strength of a trend.
Aligned bullish or bearish signals across multiple timeframes increase confidence in trade decisions.
During trending markets, price often pulls back to the 9 EMA before continuing the trend.
Traders can use these touches as low-risk entry points with stop-losses just beyond the EMA.
Speed: Reacts faster than longer EMAs or SMA, ideal for volatile crypto and forex markets.
Simplicity: Easy to interpret visually and suitable for traders at all levels.
Versatility: Effective across multiple markets, including forex, crypto, and stocks.
Compatibility: Can be combined with other indicators (RSI, MACD, Bollinger Bands) for stronger signals.
False Signals: The 9 EMA may produce whipsaws during sideways or choppy markets.
Over-Sensitivity: Rapid reactions can trigger premature entries or exits.
Not Standalone: Relying on it alone can be risky; confirmation with other tools is recommended.
Combine with Momentum Indicators: Use RSI or MACD to confirm trend strength.
Include Volume Analysis: Validate breakouts or reversals for higher accuracy.
Apply Proper Risk Management: Use stop-losses and define risk-reward ratios.
Backtest Strategies: Test the 9 EMA strategy in historical data or demo accounts.
Forex: Day traders use the 9 EMA for pairs like EUR/USD, GBP/JPY, and USD/JPY to spot intraday trends.
Crypto: Rapid moves in Bitcoin, Ethereum, and altcoins make the 9 EMA ideal for timing short-term entries.
Stocks: Scalpers and swing traders use it to identify momentum and trend direction in trending equities.
Example: During a strong Ethereum uptrend, the price often remains above the 9 EMA. Traders entering on minor pullbacks to the EMA line can capture significant gains while limiting risk.

The 9 EMA is more than a chart line—it highlights momentum, short-term trends, and precise trade timing.
Its speed makes it powerful in fast-moving crypto and forex markets, but it can mislead in sideways conditions.
Success comes from combining the 9 EMA with multi-timeframe analysis, supporting indicators, and disciplined risk management.
Traders who use it thoughtfully can anticipate market moves, turning volatility into informed trading opportunities.
1. What timeframe works best with the 9 EMA?
Short-term traders often use 5-min, 15-min, or 1-hour charts for crypto and forex. Longer timeframes smooth signals but reduce responsiveness.
2. How can I reduce false signals?
Combine the 9 EMA with indicators like RSI, MACD, or volume analysis to confirm momentum before acting.
3. Can I use multiple 9 EMAs?
Yes. Aligning 9 EMAs across different timeframes filters noise and increases confidence in trades.
4. Is the 9 EMA better than the 20 EMA or SMA?
The 9 EMA reacts faster, making it ideal for short-term trading. Longer EMAs or SMAs offer smoother, less sensitive signals for trend analysis.
Disclaimer: This material is for general information purposes only and is not intended as (and should not be considered to be) financial, investment or other advice on which reliance should be placed. No opinion given in the material constitutes a recommendation by EBC or the author that any particular investment, security, transaction or investment strategy is suitable for any specific person.