Published on: 2025-08-21
Updated on: 2025-08-21
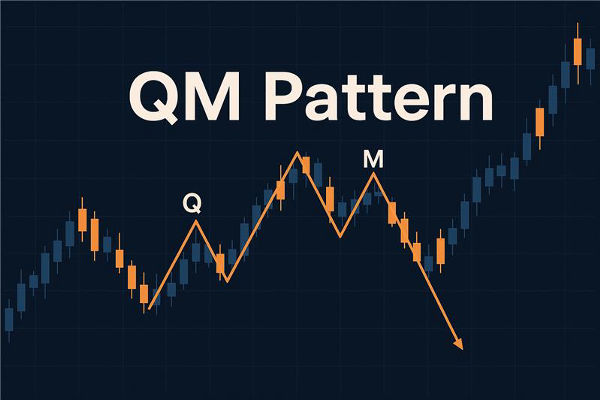
In price action trading, patterns are powerful tools that reveal how supply and demand drive market behaviour. One of the most popular advanced price action setups is the Quasimodo Pattern (QM Pattern). Recognised by its distinct structure of higher highs and lower lows, the QM Pattern helps traders identify potential reversals at key levels.
So, what is the QM Pattern in trading? Simply put, the QM Pattern signals when the market has exhausted a trend and is preparing to reverse, offering high-probability entries for traders.
This guide explains what the QM Pattern is, how it forms, real-world examples, and practical trading strategies that can help you apply it with confidence.

The Quasimodo (QM) Pattern, sometimes called the Over and Under (O&U) pattern, is a price action reversal formation. It gets its name because the shape resembles a leaning figure, just like the hunchback Quasimodo from literature.
The pattern typically forms after a trending move when the market creates:
A higher high (HH)
A higher low (HL)
Another higher high (HH)
A lower low (LL)
A final pullback that often reverses from the previous higher low area
This pattern suggests that the market has disrupted the trend structure and is about to change direction.
To understand it better, let's break down the steps in formation:
Trending Move: The market is in an uptrend or downtrend, creating higher highs or lower lows.
Key Swing Points: A higher high is formed, followed by a retracement.
Failure of Trend Structure: The market makes a new lower low after the higher high (or a higher high after a lower low in bearish scenarios).
Quasimodo Level: The pattern highlights an imbalance between buyers and sellers. The retracement back to the QM level is where reversal trades often occur.
Example: In an uptrend, if the market forms HH → HL → HH → LL → retest, the LL confirms that buyers lost control. The retest of the prior HL area becomes the QM short entry zone.

| Feature | Bullish QM Pattern | Bearish QM Pattern |
|---|---|---|
| Market Context | Appears at the end of a downtrend | Appears at the end of an uptrend |
| Structure Shift | Price makes a lower low followed by a higher high | Price makes a higher high followed by a lower low |
| QM Level | Acts as a support zone where price may reverse upward | Acts as a resistance zone where price may reverse downward |
| Trader’s Bias | Signals a buying opportunity | Signals a selling opportunity |
| Confirmation Tools | Best confirmed with oversold indicators, bullish candlestick patterns, or demand zones | Best confirmed with overbought indicators, bearish candlestick patterns, or supply zones |
| Risk Factor | False breakouts may lead to premature buying | False breakouts may lead to premature selling |
Step 1: Identify the Trend
Determine whether the market is trending up or down before spotting the QM setup.
Step 2: Spot the Key Swing Points
Mark HH, HL, LL, and LH points on your chart.
Step 3: Confirm the Break of Structure (BOS)
The break of the trend structure is the most critical signal.
Step 4: Wait for the Retest of the QM Level
The QM trade entry usually comes when the price pulls back to the prior HL (in bearish setups) or LH (in bullish setups).
Step 5: Execute with Risk Management
Entry: At QM level (supply/demand zone)
Stop-Loss: Above HH (for bearish) or below LL (for bullish)
Take-Profit: Near the next structure level or demand/supply zone

1. Supply and Demand Strategy
Combine QM levels with supply and demand zones. The QM pattern aligns perfectly with institutional footprints, offering low-risk, high-reward trades.
2. Fibonacci Confluence Strategy
When the QM level overlaps with a Fibonacci retracement zone (61.8% or 78.6%), the trade setup becomes stronger.
3. Multi-Timeframe Strategy
Look for QM setups on higher timeframes (H4, D1) and refine entries on smaller timeframes (M15, M5).
4. Order Flow and Liquidity Strategy
Smart money often creates false breakouts to trap traders. Watching liquidity grabs alongside the QM setup can boost accuracy.
5. Indicator Confirmation Strategy
While the QM pattern is price-action based, confirmation from RSI divergence or MACD crossover can add confidence to the trade.
Practice identifying QM setups on past charts before engaging in live trading.
Use stop-loss orders strictly, as QM setups can fail if news events disrupt markets.
Always confirm the QM with volume and momentum indicators.
Avoid trading QM patterns during low liquidity sessions (e.g., Asian forex hours).
Combine QM with a broader market context, rather than treating it as an independent strategy.
1. What Is the QM Pattern in Trading?
The QM Pattern is a price action reversal setup that signals a potential trend change when the market structure shifts from making higher highs to lower lows (or vice versa).
2. Which Markets Can the QM Pattern Be Used In?
Traders can use the QM Pattern in forex, stocks, commodities, and indices, as it relies on pure price action.
3. Is the QM Pattern Suitable for Beginners?
The QM Pattern is more advanced because it requires accurate identification of swing points and market structure; thus, it's typically advised for traders who have some experience with price action.
In conclusion, the QM Pattern is a powerful price action tool for identifying trend reversals with precision. Like any strategy, it requires patience, discipline, and consistent practice.
For best results, integrate QM setups with supply and demand assessments, Fibonacci levels, and confirmations from higher timeframes.
Disclaimer: This material is for general information purposes only and is not intended as (and should not be considered to be) financial, investment or other advice on which reliance should be placed. No opinion given in the material constitutes a recommendation by EBC or the author that any particular investment, security, transaction or investment strategy is suitable for any specific person.