Published on: 2025-12-11
Updated on: 2025-12-11
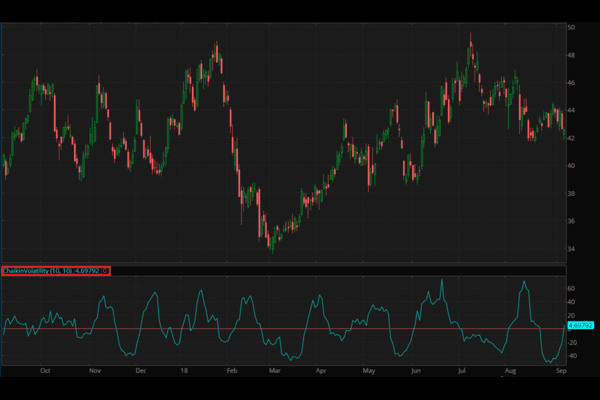
Chaikin Volatility is a technical volatility indicator that tracks how fast the trading range of a market is changing over time.
It looks at the gap between the high and low price for each candle, then applies an exponential moving average and measures the percentage change in that average over a set number of periods, often 10.
In simple words, it tells you whether price bars are starting to stretch out or calm down. This matters for traders because rapid changes in volatility often come before strong trends, sharp reversals, or stop-outs. Knowing when volatility is expanding or shrinking can help you choose when to enter, how far to place stops, and whether to reduce or increase position size.
In trading, Chaikin Volatility tracks the change in the trading range, which is the distance between the high and low prices of each period. It compares the current average range with the range from several periods earlier.
This helps traders see if the market is entering a phase of wider swings or narrowing movement.

You will find this indicator on most trading platforms under volatility or oscillator tools. It appears as a line that moves above or below zero, or sometimes as a percentage reading. Short term traders, such as intraday and swing traders, watch it most because changes in price range can signal shifts in market mood.
Chaikin Volatility uses the exponential moving average (EMA) of the high-low range.
EMAN(H−L)N periods ago ÷ EMAN(H−L)−EMAN(H−L)N periods ago×100
Compute the EMA of the High minus Low over N periods.
Compare it with the EMA from N periods earlier.
This gives a percentage change in the trading range.
The indicator rises when the market shows stronger price swings. It falls when swings settle down. Key drivers include:
News releases. When major data or central bank decisions appear, the price range often expands. Chaikin Volatility tends to rise.
Shift in risk mood. When traders move from calm to fearful, markets often see sharp highs and lows. The indicator usually climbs.
Low activity periods. During holidays or quiet sessions, highs and lows tighten. The indicator usually drops.
Breakout setups. As price approaches a key support or resistance level, early expansion in the range can lift the indicator.
Chaikin Volatility can influence both timing and cost. When the indicator is high, prices may move more sharply. This can make entries harder to place at the level you expect.
Exit points may also hit faster, both for profit and for loss. Wider ranges can increase slippage and may cause spreads to widen around news.
When the indicator is low, price tends to drift. Entries and exits may be easier to control, but the market may not move enough to reach targets quickly. Traders often adjust their stop distances and expectations based on how active the range looks.
Good signs
Clear rise in volatility near a breakout level.
Low but stable volatility during a calm trend.
Risk signs
Sudden volatility spikes with no clear trend.
Sharp drops in volatility inside a choppy range.
Suppose EURUSD trades with an average daily range of 40 pips over the past 10 days. A week later the average daily range rises to 60 pips. Chaikin Volatility compares these averages. The increase from 40 to 60 pips is a 50 percent change.

A trader opening a short term position sees this rise and understands that price may swing harder. A stop that made sense at 20 pips might now be too tight. A target may hit faster, but risk also grows.
If the indicator had fallen from 40 to 20 pips, it would signal a quieter market where moves may take longer.
Look at the indicator line on your chart and compare it with the past few weeks.
See if the line is rising, falling, or staying flat.
Check how close the market is to major support or resistance.
Note if a news event is coming, since this can change the range.
Compare the indicator with the size of recent candles. If candles are growing, volatility is rising.
Tip: Check it before every new setup and once per session during active trade hours.
Using it as a buy or sell signal. It measures activity, not direction, so using it alone can mislead.
Ignoring the trend. High volatility inside a trend can support momentum, but high volatility in a range can mean noise.
Not adjusting stop size. Stops that are too tight in a high volatility phase often get hit early.
Reading it in too short a timeframe. Very small timeframes can create false signals.
Forgetting news timing. Many spikes come from data releases, not from real trend change.
Bollinger Bands: widen and narrow based on volatility levels.
Standard deviation: the core idea behind many volatility tools.
Slippage: can increase during high volatility periods.
Spread: brokers may widen spreads when volatility rises.
Chaikin Volatility tracks how much the high-low range of recent candles is expanding or shrinking. When the range grows, the indicator rises, showing increased activity. When the range tightens, the indicator falls, showing calmer trading conditions.
Beginners should read it as a simple “energy gauge.” Rising volatility means the market is becoming more active and swings may widen. Falling volatility means movement is slowing. The key is to watch the general direction of the line, not every small turn.
Most platforms use a 10-period EMA of the high-low range and compare it with the value from 10 periods earlier. These settings respond fast enough for short term charts while keeping noise low. Longer settings give smoother signals if the market is choppy.
Not by itself. A spike only shows that the price range is expanding. A real breakout needs structure, such as a clear trend, a break above or below a key level, and steady momentum. Volatility rising without direction may simply reflect news or uncertainty.
Because the indicator reacts to sudden changes in candle size. News events, session opens, or fast moves can widen the high-low range in one or two candles. This creates a sharp rise even if no trend forms afterward.
Yes. High readings warn that price may move fast and stops may need more room. Low readings suggest quieter movement, which can help with tighter stops and more predictable entries. It gives a quick sense of how stable or unstable the market is.
Many traders like it on 1-hour, 4-hour, and daily charts, where noise is lower. On very short timeframes, you may see many small changes that are hard to trade. The best approach is to test and see where it gives clear, meaningful shifts instead of constant flickers.
Chaikin Volatility is a volatility indicator that tracks how fast the trading range between high and low prices is changing. It does not predict direction, but it shows when the market is waking up or calming down. Used with price action, trend tools, and a clear risk plan, it can help you spot possible breakouts, avoid panic periods, and choose more suitable position sizes.
Used alone or ignored during news, it can lead to confusion. The heart of the tool is simple: it tells you how strong the market’s movement is becoming.
Disclaimer: This material is for general information purposes only and is not intended as (and should not be considered to be) financial, investment or other advice on which reliance should be placed. No opinion given in the material constitutes a recommendation by EBC or the author that any particular investment, security, transaction or investment strategy is suitable for any specific person.


World's Best Broker