Published on: 2025-05-16
Among the most powerful Chart Patterns, the Falling Wedge Pattern is a formation that frequently signals a potential reversal or continuation in trend. Understanding how to identify, interpret, and trade this pattern can significantly improve your trading decisions and market timing.
In this comprehensive guide, we'll explore the definition of the Falling Wedge pattern, how it forms, what it indicates, how to trade it effectively, and the key differences between falling wedges and other similar patterns.

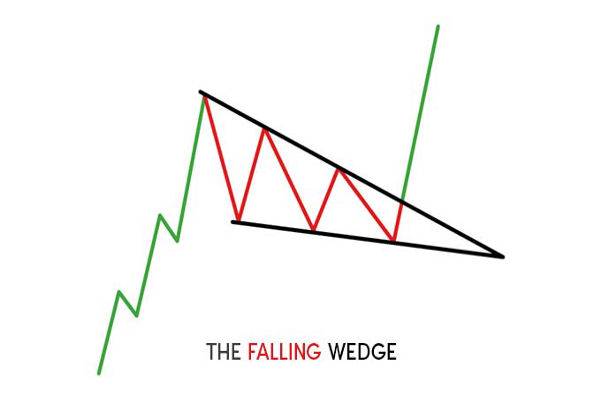
The Falling Wedge pattern appears as a bullish technical pattern on price charts when the market experiences a narrowing range between highs and lows, with both trendlines sloping downward. Despite this downward movement, it often suggests a potential bullish breakout either as a reversal from a downtrend or a continuation during an uptrend.
This pattern forms when the price consolidates between two converging downward sloping trendlines. The slope of the upper trendline (resistance) is steeper than that of the lower trendline (support), reflecting a slowdown in selling momentum and the possibility of a bullish breakout once resistance is breached.
There are two types of Falling Wedge patterns:
Reversal Falling Wedge: Appears during a downtrend and signals a potential bullish reversal.
Continuation Falling Wedge: Appears during an uptrend and signals a continuation of the bullish trend after consolidation.
In both cases, the key feature of a Falling Wedge is that it indicates the exhaustion of sellers and an increasing chance of an upward breakout.
Key Characteristics
Trendlines converge downward: Both support and resistance lines slope down, with the resistance line sloping more steeply.
Volume decreases: Typically, volume fades as the pattern progresses, showing decreasing interest until a breakout.
Duration varies: It can last from several weeks to a few months, depending on the market context and timeframe.
Breakout direction: Despite the downward trend, the breakout is usually to the upside.
Recognising these characteristics helps validate the pattern and improves the likelihood of a successful trade.

To spot a Falling Wedge pattern on your charts, follow these steps:
Look for a downtrending price action with lower highs and lower lows.
Draw two converging downward trendlines that contain the price action.
Confirm that the volume decreases as the pattern progresses.
Watch for a bullish breakout above the upper resistance trendline.
Use technical indicators like RSI or MACD to confirm a bullish divergence or momentum shift.
Identifying the pattern early allows traders to prepare for potential breakout trades with favourable risk-reward setups.
What the Falling Wedge Tells Traders
As mentioned, the pattern suggests a deceleration of selling pressure and an increase in potential for buyers to regain control. Here's what it typically means in different market contexts:
In a downtrend (reversal wedge): The pattern signals that the sellers are losing steam and the asset may be approaching a bottom. Buyers might soon step in and reverse the downtrend.
In an uptrend (continuation wedge): The market takes a breather or consolidates. The pattern acts as a pause before continuing the upward trajectory after breaking above resistance.
In both scenarios, a confirmed breakout accompanied by high volume is a bullish signal and may indicate the start of a new leg higher.
Real-World Examples
Example 1: Tesla (TSLA) - Reversal Wedge
In mid-2021, TSLA experienced a significant downtrend forming a clear Falling Wedge pattern. As the price made lower highs and lower lows, the pattern narrowed. Eventually, a breakout occurred on strong volume, leading to a massive rally that recaptured previous highs.
Example 2: Gold (XAU/USD) - Continuation Wedge
During an uptrend in 2020, gold prices paused and formed a Falling Wedge. The market consolidated for weeks within the wedge before breaking above resistance. The breakout resumed the uptrend, pushing prices to new highs.
These examples demonstrate how the Falling Wedge can be a potent tool in different asset classes and market contexts.

Identify the pattern in a strong downtrend or during consolidation in an uptrend.
Wait for the breakout above the resistance line, preferably confirmed by volume.
Enter the trade after the breakout or on the retest of the breakout zone.
Set a stop loss below the last swing low or support line to limit losses.
Establish a target using the wedge's height or key resistance zones.
While the Falling Wedge can stand alone as a pattern, combining it with technical indicators can improve your trading edge. Here are some useful tools:
Relative Strength Index (RSI): Look for bullish divergence (RSI rising while price makes lower lows), which supports a breakout.
Moving Averages: A crossover (e.g., 20 EMA crossing above 50 EMA) after the breakout can confirm a trend shift.
MACD: A bullish crossover of the MACD line above the signal line, especially from below the zero level, strengthens the reversal case.
Volume: Increasing volume during the breakout adds confirmation and conviction.
Common Mistakes to Avoid
Forcing the pattern: Not every downward channel is a Falling Wedge. Ensure proper convergence and pattern structure.
Ignoring volume: A breakout without volume may be weak or false. Always check volume confirmation.
Premature entry: Jumping in before a clear breakout can lead to losses if the wedge continues.
No stop loss: Trading without a stop loss exposes you to massive losses if the breakout fails.
Not waiting for confirmation: Entering without a confirmed breakout increases your exposure to false signals.
In conclusion, the Falling Wedge pattern is a powerful tool that offers traders a high-probability setup when interpreted correctly. Whether signalling a bullish reversal in a downtrend or a continuation in an uptrend, the Falling Wedge provides a clear visual cue of waning selling momentum and potential buying pressure.
With practice, patience, and proper analysis, you can incorporate the Falling Wedge pattern into your trading arsenal and make more informed, strategic decisions.
Disclaimer: This material is for general information purposes only and is not intended as (and should not be considered to be) financial, investment or other advice on which reliance should be placed. No opinion given in the material constitutes a recommendation by EBC or the author that any particular investment, security, transaction or investment strategy is suitable for any specific person.