Published on: 2025-08-13
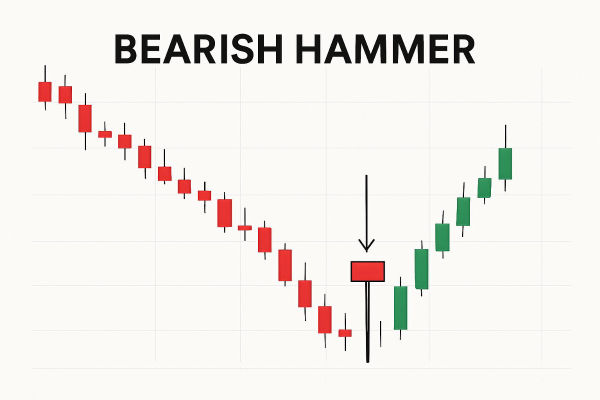
A bearish hammer candlestick is a single-candle reversal signal that appears during uptrends or at resistance levels. Contrary to its name, the bearish hammer does not indicate bullish continuation but instead hints at potential downside pressure after a temporary buying attempt fails.
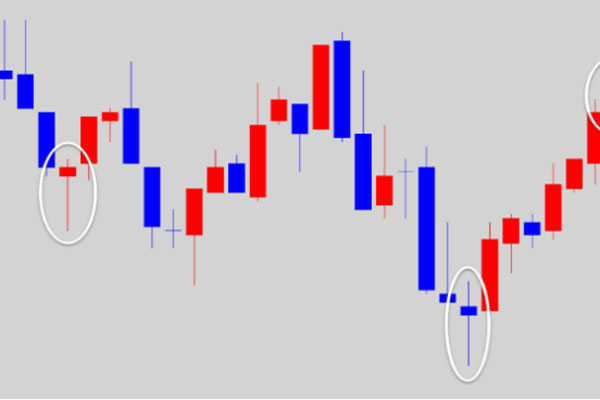
A bearish hammer candlestick occurs when prices open, drop significantly during the session, recover partially, but close near the open. It leaves a long lower shadow and a small real body at the top of the candle.
This article will delve deeper into what the bearish hammer candlestick means, how it forms, its examples and how traders can use it effectively without falling into common traps.

As mentioned above, a bearish hammer candlestick is a single-candle reversal signal that appears during uptrends or at resistance levels.
A bearish hammer candlestick typically has the following traits:
Small Real Body: Located at the upper part of the candle.
Long Lower Shadow: At least twice the length of the real body.
Little to No Upper Shadow: Shows buyers failed to sustain highs.
Forms After an Uptrend: Context is critical for bearish interpretation
It suggests that buyers initially pushed prices higher, but sellers regained control, driving the price lower before the candle closed. This selling pressure often warns that the upward momentum is weakening, and a price reversal or correction may follow.

The bearish hammer forms due to a battle between buyers and sellers within a single trading period. Here's the breakdown:
Opening Price: The session starts in line with the ongoing bullish sentiment.
Intraday Drop: Sellers push the price significantly lower, creating a long lower shadow.
Partial Recovery: Purchasers make an effort to recover but are unsuccessful in pushing the price.
Close Near Open: The candle closes near the opening price, indicating that buying momentum has weakened.
For additional context, candlestick patterns represent crowd behaviour in the market.
Early in the session, buyers feel confident due to the ongoing uptrend.
During Mid-session, sellers overpower buyers, pushing the price sharply lower.
At the end of the session, buyers try to push prices up but fail to retake control.
This loss of momentum by buyers signals to traders that selling pressure could dominate in the next session.
| Feature | Bearish Hammer | Bullish Hammer |
|---|---|---|
| Trend Context | Appears at the top of an uptrend | Appears at the bottom of a downtrend |
| Market Signal | Potential bearish reversal | Potential bullish reversal |
| Candle Shape | Small real body at the top with a long lower shadow | Small real body at the top with a long lower shadow (identical shape) |
| Psychology | Buyers attempt to push prices higher but fail; sellers regain control | Sellers push prices down but fail; buyers regain control |
| Next Candle Confirmation | Bearish (closing lower) confirms the reversal | Bullish (closing higher) confirms the reversal |
| Trading Action | Look for short-selling opportunities after confirmation | Look for buying opportunities after confirmation |

1. Identify the Pattern
Ensure the candle has a long lower shadow (at least twice the real body), a small upper shadow, and forms at the end of an uptrend.
2. Wait for Confirmation
Confirmation often comes with the next candle closing lower than the bearish hammer's close.
3. Place Your Entry
Enter short trades after confirmation, ideally when the price breaks below the low of the bearish hammer.
4. Set a Stop Loss
Place a stop loss above the high of the hammer to manage risk.
5. Target Levels
Use nearby support zones or Fibonacci retracement levels for profit targets.
Furthermore, the bearish hammer may appear at the end of bullish currency pair rallies, signalling a possible reversal. Traders often combine it with indicators to validate entry points.
For example, traders often use it in combination with:
Resistance levels
Overbought RSI readings
Bearish divergence in the MACD
Volume spikes indicate selling pressure
While the bearish hammer can be an effective signal, it's not foolproof:
Strengths:
Simple to identify
Provides clear entry/stop points
Works well with other technical tools
Limitations:
Can produce false signals in choppy markets
Requires confirmation from subsequent candles
Less reliable in low-volume markets
Thus:
Always check the trend before acting.
Combine with at least one momentum or volume indicator.
Avoid entering before the pattern is confirmed.
Manage risk with tight stop-loss levels.
Q1. Does a Bearish Hammer Always Mean the Market Will Drop?
No, it's only a signal of potential reversal. Traders should confirm the pattern with the next candle and other technical indicators before acting.
Q2. What Timeframes Work Best for Spotting a Bearish Hammer?
It can be used on any timeframe, but higher timeframes, such as daily or weekly charts, tend to produce more reliable signals.
Q3. Can a Bearish Hammer Appear in Forex Trading?
Yes, the bearish hammer frequently appears in Forex charts, stocks, commodities, and various other markets, making it a flexible pattern for technical analysis.
In conclusion, the bearish hammer candlestick is a valuable pattern for identifying market reversals. It is most effective when used with more comprehensive technical analysis tools.
When used correctly, this pattern can help traders anticipate when an uptrend is losing steam and position themselves for profitable moves in the opposite direction.
Disclaimer: This material is for general information purposes only and is not intended as (and should not be considered to be) financial, investment or other advice on which reliance should be placed. No opinion given in the material constitutes a recommendation by EBC or the author that any particular investment, security, transaction or investment strategy is suitable for any specific person.