Published on: 2025-06-17
In technical analysis, Chart Patterns serve as essential tools for predicting future price movements. One such pattern, the Rounding Bottom, is particularly popular among swing and position traders for identifying potential trend reversals.
Although it may not be as aggressive as other formations, such as head and shoulders or triangles, its reliability and smooth transition from bearish to bullish sentiment make it a powerful indicator for savvy traders.
This article provides a clear explanation of the rounding bottom chart pattern, trading strategies suitable for both beginners and experienced traders and market examples to illustrate its effectiveness in various scenarios.

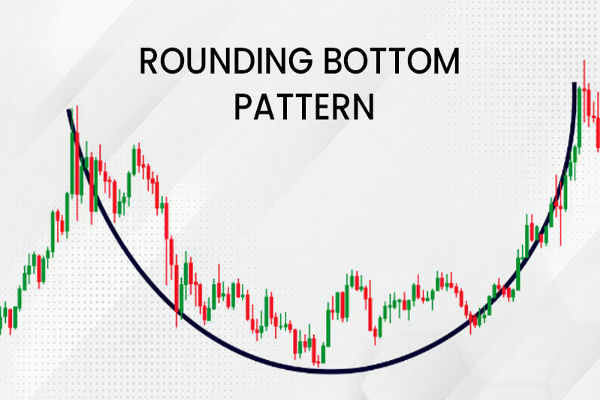
A Rounding Bottom, also known as a Saucer Bottom, is a technical chart pattern that signals a reversal from a downtrend to an uptrend. It resembles the shape of a bowl or a 'U' and typically forms over a longer time frame, such as several weeks or months.
This pattern indicates a gradual shift in sentiment from selling pressure to buying interest.
The pattern is characterised by a decline in price that slows down, stabilises at a support level, and then starts to climb slowly, eventually breaking out above the resistance level formed at the beginning of the downtrend.
Anatomy
Understanding the internal structure of the rounding bottom helps traders grasp how market sentiment shifts across the formation.
Downtrend Phase: The asset starts with a persistent decline, marked by lower highs and lower lows.
Stabilisation: Momentum slows down as prices hover at a low level, indicating weakening bearish control.
Bottom Formation: Price action flattens, forming the base of the "U," where volume is typically the lowest.
Uptrend Phase: Buying interest returns gradually, and prices begin to rise with higher lows and increasing volume.
Breakout: Once the price surpasses the initial resistance level (the starting point of the pattern), a bullish breakout confirms the pattern.

While spotting a rounding bottom may seem straightforward, it requires attention to detail:
The overall formation should look like a symmetrical "U," not a "V," which indicates a sharp reversal.
Volume tends to decrease during the initial decline, bottom out during the consolidation and increase during the breakout.
The pattern generally appears on daily or weekly charts, making it more suitable for long-term trading strategies.
Using charting tools such as trendlines, moving averages, and volume indicators can help confirm the formation of a rounding bottom.
Differences Between Rounding Bottom and Other Reversal Patterns
| Pattern | Shape | Reversal Direction | Duration | Key Indicator |
|---|---|---|---|---|
| Rounding Bottom | U-shaped | Bearish to Bullish | Long-term | Gradual volume increase |
| Double Bottom | W-shaped | Bearish to Bullish | Medium-term | Two support retests |
| Head and Shoulders | Three peaks | Bullish to Bearish | Medium to Long | Neckline break |
| Inverse Head & Shoulders | Three troughs | Bearish to Bullish | Medium to Long | Volume spike at breakout |

1. Wait for Pattern Completion
The most common mistake traders make is entering too early. The safest entry point is after the price breaks above the resistance level, which serves as the neckline of the pattern. It confirms the end of the downtrend and the beginning of a new uptrend.
2. Confirm with Volume
Volume is a crucial component of the rounding bottom pattern. The breakout should have a notable increase in volume. It confirms the breakout and indicates strong market interest.
3. Set Entry Point
Once the breakout is confirmed, enter a long position slightly above the resistance level. It helps avoid false breakouts and ensures the trend is gaining momentum.
4. Define Stop-Loss
Set a stop-loss order just below the lowest point of the pattern or below the breakout level. It protects against unexpected reversals and limits risk exposure.
5. Establish Profit Target
The target price is usually calculated by measuring the vertical distance between the lowest point of the pattern and the resistance line. This value is then added to the breakout point to determine the potential upside.
Ideal Conditions
Rounding bottoms is most effective in markets that are emerging from extended downtrends. They are commonly seen after a period of investor pessimism, poor earnings, or macroeconomic uncertainty. The pattern serves as a foundation for a new bullish phase, particularly in:
Individual stocks recovering from earnings slumps
Commodities bouncing back after oversupply corrections
Patience is key, as rounding bottoms are slow to form but offer excellent risk-to-reward ratios once confirmed.
Real-World Examples
A well-documented rounding bottom example occurred in Apple's stock during 2008–2009. After a prolonged market decline during the financial crisis, Apple's price stabilised and began forming a U-shaped curve.
As economic conditions improved, investor confidence returned, volume increased, and AAPL broke above the neckline around mid-2009. It led to a strong uptrend that lasted several years.
This case highlights how rounding bottoms can be leveraged for long-term investment decisions when macroeconomic factors begin to favour growth.
Although the pattern is relatively easy to identify, several mistakes can reduce its effectiveness. Therefore:
Always confirm the breakout with volume.
Use trendlines and horizontal resistance lines to mark the neckline.
Practice identifying rounding bottoms using demo accounts before trading real money.
Combine technical analysis with fundamental insights to strengthen your conviction.
Avoid using high leverage due to the slow-developing nature of the pattern.
In conclusion, the Rounding Bottom pattern is a timeless and effective reversal signal for traders and investors who are willing to wait for the setup to form fully. Its gradual build-up, coupled with strong volume confirmation and predictable breakout potential, makes it ideal for long-term market plays.
As always, backtest your strategies, apply strong risk management, and remain patient. The success of the rounding bottom isn't just about spotting it—it's about executing your trade plan with discipline and clarity.
Disclaimer: This material is for general information purposes only and is not intended as (and should not be considered to be) financial, investment or other advice on which reliance should be placed. No opinion given in the material constitutes a recommendation by EBC or the author that any particular investment, security, transaction or investment strategy is suitable for any specific person.