Published on: 2025-09-30

Technical Analysis of the Financial Markets remains one of the clearest, most practical guides for reading price charts and applying technical methods to trading and investing.
It combines classical charting with modern tools and intermarket thinking to give readers a robust toolbox for market analysis.
This article explains why Technical Analysis of the Financial Markets remains influential, outlines its core principles, explores key charting methods and indicators, examines practical applications and limitations, and presents illustrative examples from real market scenarios.
John J. Murphy's Technical Analysis of the Financial Markets was published as a comprehensive guide in 1999 and has been widely used since as a reference for technicians, traders and students of markets.
Murphy draws on decades of market experience — including roles at Merrill Lynch and as CNBC's technical analyst — to explain not just how charting tools work, but why they matter in a modern, interlinked market environment.
The book's scope, combining chart basics, indicators, pattern analysis and intermarket relationships, makes it a durable primer for both beginners and experienced practitioners.

Markets discount everything. Prices reflect available information and collective expectations.
History tends to repeat. Human behaviour produces recurring price patterns and tendencies.
Trends persist. Identifying and aligning with a prevailing trend gives a statistical edge.
These are not dogmas but working assumptions. Murphy uses them as the starting point for practical techniques that turn price and volume data into tradeable signals.
Murphy situates modern technical analysis in the lineage of Dow Theory, classical chartists and later innovations (candlesticks from Japan, point-and-figure charts, and later computer-based indicators).
That historical context helps explain why some tools remain useful and why others must be adapted to new market structures.
Murphy explains the principal chart types — line, bar, candlestick and point-and-figure — and shows where each is most effective:
| Chart type | Strengths | Typical use |
| Line chart | Simple view of close prices | Long-term trend identification |
| Bar chart | Shows open-high-low-close (OHLC) | Detailed daily/weekly analysis |
| Candlestick | OHLC plus visual patterns | Short- to medium-term entry/exit signals |
| Point & Figure | Filters noise, focuses on price moves | Breakout and support/resistance analysis |
Each charting style delivers the same price history with different emphasises. Choosing the right chart is a matter of clarity of signal and the trader's time horizon.
Murphy stresses alignment across timeframes: use a long-term chart to define the primary trend, a medium-term chart to find the trading bias, and a short-term chart to time entries and exits.
He also defines the building blocks of market structure — support, resistance, trend lines and channels — and explains how these features interact across timeframes.

Murphy provides clear rules and illustrations for reversal formations such as head & shoulders, double and triple tops/bottoms, and rounding bottoms. He emphasises confirmation (e.g. neckline breaks, volume confirmation) and cautions against premature entries on unconfirmed formations.
Patterns like flags, pennants and triangles are treated as pauses in a trend. Murphy describes how to measure targets from these patterns and the importance of volume behaviour through the formation and breakout.
Although Murphy's book is broad rather than exclusively candlestick-based, he includes candlestick patterns (engulfing patterns, dojis, hammers, shooting stars) as complementary tools that can confirm or warn against pattern breakouts.
Murphy explains how momentum tools such as RSI (Relative Strength Index), MACD (Moving Average Convergence Divergence) and stochastics measure the speed of price change and help detect divergences, overbought/oversold conditions and trend shifts.
Bollinger Bands and Average True Range (ATR) provide volatility context; on-balance volume (OBV) and volume oscillators tie price moves to participation. Murphy stresses that volume often confirms the quality of a breakout or reversal.
The book covers Fibonacci retracements/extensions and the logic for using them as probable reaction areas.
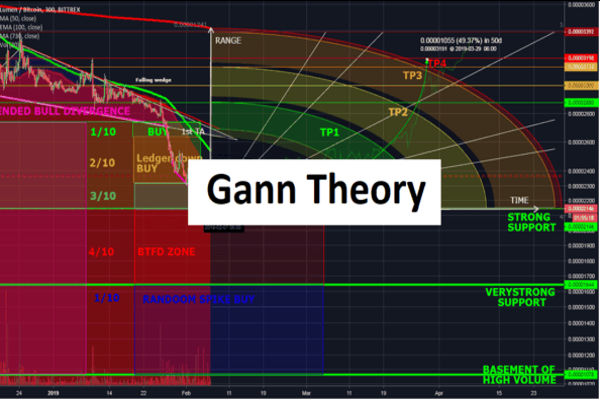
Murphy also examines Elliott Wave ideas at a conceptual level and — importantly — places strong emphasis on intermarket relationships (how bonds, commodities, currencies and equities influence each other), a theme that became a major part of his later work.
This intermarket perspective helps the analyst understand why certain patterns or trends emerge at particular times.

Combine tools, don't clutter them. Use a small set of complementary indicators (for example: a trend filter, a momentum gauge and a volume confirmation).
Define rules. Specify exact entry, stop and target conditions — ambiguity breeds inconsistent performance.
Align timeframes. Confirm that the short-term trade is compatible with the intermediate and long-term bias.
Murphy emphasises position sizing, sensible stop-loss placement and acceptable risk-per-trade. Good risk control ensures that the worst-case single trade does not imperil the account, and that repeated small losses do not compound into catastrophic drawdowns.
Before committing real capital, test the strategy on historical data and reserve an out-of-sample period to check robustness. Murphy warns against curve-fitting — a system tuned too closely to past data will often fail in live markets.
Practical backtesting examines win rate, average win/loss, drawdown and expectancy.
Murphy is upfront that technical analysis is probabilistic, not predictive. It helps stack probabilities in the analyst's favour but cannot guarantee outcomes. Markets are also affected by structural changes, policy decisions and shocks that charts alone cannot foresee.
Common human biases — confirmation bias, loss aversion, overtrading — are recurring themes. Murphy advocates disciplined record-keeping, routine review, and a rules-based approach to reduce emotional mistakes.
Keep charts uncluttered; prefer a small number of well-understood tools; validate ideas before trading; review trades objectively. These straightforward habits improve consistency far more than adding more indicators.
A simple moving-average crossover applied to a commodity futures contract can capture multi-week trends. The key is filtering whipsaws with a higher timeframe and matching position size to volatility.
A classic measured-move breakout (for instance from a rectangle or triangle) can produce high-probability trades when volume supports the breakout.
False breaks occur when the breakout lacks partner volume or occurs at a technical extreme — the remedy is clear rules for invalidation (stop placement) and modest position sizing.
The book's principles translate across asset classes, but execution must adapt: crypto tends to be more volatile, forex is heavily influenced by macro flows, and equities may react to company fundamentals.
Murphy's intermarket thinking helps identify cross-asset drivers that can make or break a technical setup.
Q1: How relevant is Technical Analysis of the Financial Markets for a beginner today?
A: Very relevant. It remains one of the most comprehensive introductions to charting, indicators and intermarket relationships. Readers will still need to supplement the book with practice and modern platform skills, but the core concepts remain foundational.
Q2: Is the book more useful for day trading or longer-term investing?
A: The book covers tools for multiple timeframes. Its principles are applicable to day trading, swing trading and longer-term investing — the difference lies in timeframe selection, trade management and position sizing.
Q3: How should I balance indicators and price action?
A: Use indicators to confirm price action, not replace it. Price is the primary source; indicators add context (momentum, volatility, volume). Avoid indicator redundancy (many indicators often measure the same thing).
Q4: Can these methods be applied to crypto and new asset classes?
A: Yes, the techniques are asset-agnostic. However, each market has its own liquidity, volatility and structural drivers — adapt position sizing and expect more frequent whipsaws in less mature markets.
Q5: Does Murphy recommend a single trading system?
A: No. Murphy provides frameworks and examples rather than a single prescriptive system; the emphasis is on understanding tools so traders can design systems that suit their objectives and temperament.
Technical Analysis of the Financial Markets remains a core text because it teaches a practical, disciplined approach to reading markets rather than promising shortcuts. Its blend of chart basics, indicator logic and intermarket perspective equips readers with a structured way to observe, test and trade.
For those serious about mastering the language of the markets, Murphy's book provides the grammar and exercises; the rest — skill, discipline and experience — must be earned on the trading floor.
Disclaimer: This material is for general information purposes only and is not intended as (and should not be considered to be) financial, investment or other advice on which reliance should be placed. No opinion given in the material constitutes a recommendation by EBC or the author that any particular investment, security, transaction or investment strategy is suitable for any specific person.