Published on: 2025-04-18
Updated on: 2026-07-21
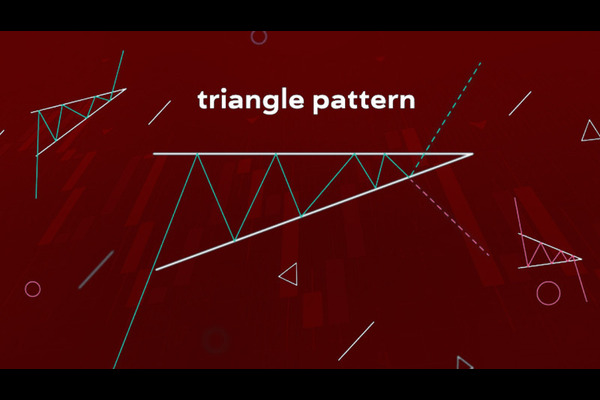
A triangle chart pattern is a period of price consolidation where the range narrows between two converging trendlines, forming a triangle shape on the chart. It shows a market pausing while buyers and sellers reach a temporary balance. Price usually breaks out of the triangle in the direction of the trend that came before it, though the direction is never certain in advance.
There are three main types: the ascending triangle, the descending triangle, and the symmetrical triangle. A fourth, less common type is the expanding triangle, where the range widens instead of narrowing.
A triangle chart pattern is a narrowing price range between two converging trendlines. It signals consolidation before a breakout.
The three core types are ascending (bullish bias), descending (bearish bias), and symmetrical (neutral, follows the prior trend).
Volume usually falls while the triangle forms, then rises on the breakout. A breakout on low volume is a common warning sign of a false move.
A price target is estimated by measuring the height of the triangle at its widest point and projecting it from the breakout level.
Historical data shows triangles work often but not always. Break-even failure rates run from about 17% to 38% depending on type and direction, so risk control matters.

A triangle forms when price makes a series of swings that get smaller over time. Draw a line across the swing highs and another across the swing lows. As the range tightens, those two lines move closer together and meet at a point called the apex. The result looks like a triangle lying on its side.
The pattern reflects a fight between two groups. One side is willing to buy at higher and higher prices, or sell at lower and lower prices, while the other defends a fixed level. As the swings shrink, the market coils. When one side finally wins, price breaks out of the triangle, often with a sharp move.
Triangles are usually continuation patterns. That means price tends to leave the triangle in the same direction as the trend that led into it. But they can also mark a reversal, especially when they form after a long trend that is running out of strength. Because of this, traders wait for the breakout to confirm direction rather than guessing early.
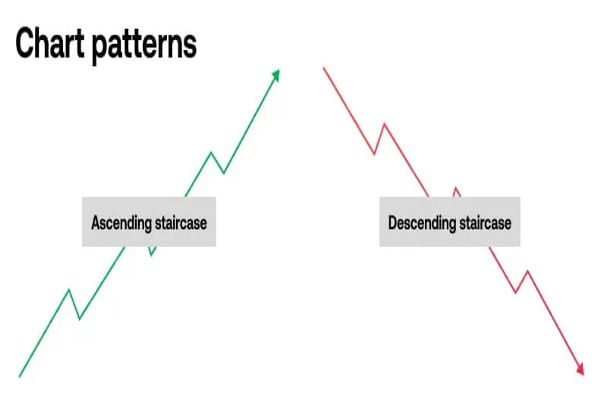
To see where triangles sit among other formations, start with the main guide to chart patterns, which covers the full set traders watch for.
The type of triangle depends on the slope of the two trendlines. One line may be flat while the other slopes, or both may slope toward each other.
Type |
Upper trendline |
Lower trendline |
Directional bias |
Typical breakout |
Ascending |
Flat (equal highs) |
Rising (higher lows) |
Bullish |
Often upward |
Descending |
Falling (lower highs) |
Flat (equal lows) |
Bearish |
Often downward, but not always |
Symmetrical |
Falling (lower highs) |
Rising (higher lows) |
Neutral |
Follows the prior trend |
An ascending triangle has a flat upper line connecting a series of highs at about the same level, and a rising lower line connecting higher lows. Price keeps testing the same ceiling while the floor lifts underneath it.
This shape shows buyers stepping in earlier on each dip, pushing the lows higher, while sellers hold firm at one resistance level. Demand is slowly absorbing the supply sitting at that ceiling. When buyers finally clear it, price often breaks upward.
The ascending triangle is generally a bullish continuation pattern. It is sometimes called a flat-top triangle, or a right-angle triangle, because one line is horizontal. In historical stock data compiled by Thomas Bulkowski in the Encyclopedia of Chart Patterns, ascending triangles broke out upward about 63% of the time.
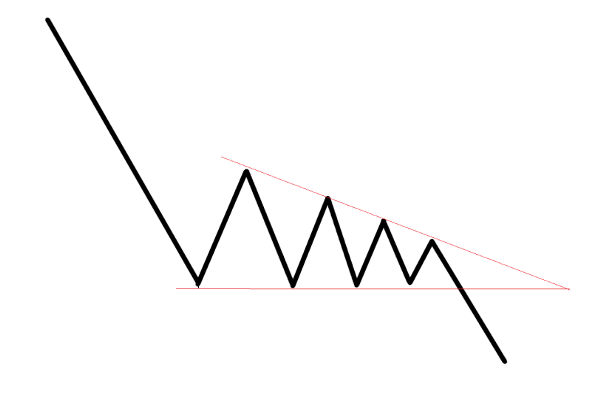
A descending triangle is the mirror image. It has a flat lower line connecting lows at about the same level, and a falling upper line connecting lower highs. Price keeps testing the same floor while the ceiling presses down.
Here, sellers accept lower prices on each bounce, dragging the highs down, while buyers defend one support level. This is usually read as a bearish continuation pattern, and it does tend to break downward when it appears inside a falling market.
One point is often taught too simply. Many guides present the descending triangle as an automatic sell signal. Across Bulkowski’s full stock sample, though, descending triangles broke out upward about 53% of the time, close to a coin flip. The bearish reading holds best when the wider trend is already down. This is why traders treat the flat base as a level to watch rather than a certain breakdown. It is also called a flat-bottom triangle.
A symmetrical triangle has a falling upper line and a rising lower line that converge toward each other. The highs get lower, and the lows get higher at roughly the same pace, so the triangle points forward evenly.
This is a picture of balance. Neither buyers nor sellers control the market, and the range squeezes until one side gives way. On its own, the symmetrical triangle does not favour either direction. In practice, it usually breaks in the direction of the trend that came before it, and volume on the breakout helps confirm which way. It is sometimes called a coil.
Of the three, the symmetrical triangle is the least reliable performer in the historical data, which is why direction and volume confirmation carry extra weight here.
Most triangles are converging triangles. The three types above all narrow toward an apex, with the trendlines moving closer together and volatility falling. This is the “compression before a move” idea.
A diverging triangle is the opposite. The trendlines move apart, each swing prints a higher high and a lower low, and volatility rises instead of falling. This shape is also called an expanding triangle, a broadening formation, or a megaphone, because it looks like a megaphone opening to the right.
An expanding triangle reflects instability and disagreement, and it often appears near market tops when price action becomes erratic. It is harder to work with than a converging triangle because there is no clean apex and no single breakout level. In the historical data, broadening formations are among the weaker performers, with a breakout direction close to random. Traders generally treat them with more caution than the standard converging types. For related sideways structures, see how traders handle a range-bound market.
Volume is one of the clearest clues a triangle gives. As the pattern forms and the range tightens, volume normally falls. Fewer traders act while the market waits for direction. In Bulkowski’s data, volume trended lower during formation roughly 78% of the time for ascending and descending triangles, and 84% to 86% of the time for symmetrical triangles.
The breakout should look different. A real breakout usually comes with a jump in volume as one side takes control and new orders flood in. A breakout on weak volume is a warning. It suggests little conviction behind the move and raises the chance of a false breakout, where price pokes past the trendline and then snaps back inside.
Volume analysis pairs naturally with the break and retest approach, which many traders use to filter out weak breakouts.
The standard method is called the measured move. It works in three steps:
Measure the height of the triangle at its widest part. This is the vertical distance between the two trendlines at the start of the pattern, known as the base.
Find the breakout point, where price closes beyond a trendline.
Project the height from the breakout point. Add it for an upward breakout, subtract it for a downward breakout.
For example, if a triangle is 60 pips tall at its base and price breaks out upward at 1.1000, the projected target is 1.1000 plus 60 pips, or 1.1060.
The target is a guide, not a promise. Historical data shows the full measured move is often not reached. Ascending triangles hit the upside target about 70% of the time, symmetrical triangles closer to 58%, and downside targets are met less often than upside ones. Because of this, many traders plan for a portion of the projected move, and treat the target as a zone rather than an exact price. The same height-projection logic appears in other formations, such as the pennant pattern.
They work often enough to be useful, but they fail regularly, so they are a probability tool and not a certainty. The most detailed public statistics come from Thomas Bulkowski’s study of thousands of patterns in US stocks, summarized in the Encyclopedia of Chart Patterns.
The table below shows his break-even failure rates. A break-even failure means price failed to move even 5% in the breakout direction after leaving the pattern.
Pattern |
Break-even failure (upward) |
Break-even failure (downward) |
Ascending triangle |
About 17% |
About 38% |
Descending triangle |
About 22% |
About 23% |
Symmetrical triangle |
About 25% |
About 37% |
Two academic and practitioner findings are worth knowing:
A study by Andrew Lo, Harry Mamaysky and Jiang Wang, published in The Journal of Finance in 2000, tested chart patterns on decades of US stock data. It found that some patterns carry useful information, but triangles were among the weaker and less consistent signals compared with reversal patterns like head and shoulders.
Bulkowski has noted that pattern performance can change over time. The reliability of some triangle setups has declined across the decades as more traders watch the same levels.
The practical lesson is not that triangles are useless. It is that a triangle raises the odds of a move in a certain direction, without removing the need for confirmation and risk control. This is why no reading of a triangle should be treated as advice to trade.
These patterns look similar and are easy to confuse. The difference is in the trendlines.
Triangle: at least one trendline is flat, or the two lines converge without sharing a slope direction. Forms over weeks to months.
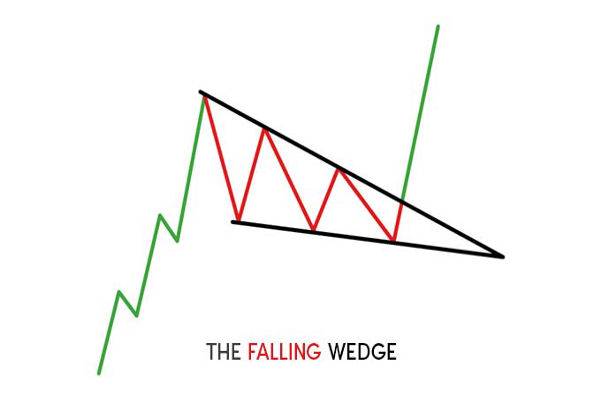
Wedge: both trendlines slope the same way. A rising wedge slopes up and tends to be bearish. A falling wedge slopes down and tends to be bullish.
Pennant: a small, short symmetrical shape that forms right after a sharp move, called the flagpole. Its target is based on the flagpole height, not the pennant itself. A pennant usually lasts only one to four weeks.
Flag: a short consolidation bounded by two parallel lines, not converging ones, after a flagpole.
A simple rule helps: if a pennant lasts longer than about twelve weeks, traders reclassify it as a symmetrical triangle. Triangles are the longer, broader formations. Pennants and flags are quick pauses inside a fast move.
The steps below describe how traders generally approach triangles. They are for education only and are not a recommendation to buy or sell anything.
Confirming the pattern. A valid triangle usually needs price to touch one trendline at least three times and the other at least twice. This fills the triangle with real price action rather than leaving empty space.
Waiting for the breakout. Most traders act on a confirmed breakout, meaning a candle that closes beyond the trendline, ideally with rising volume. Breakouts tend to happen before price reaches the apex. Moves that come very close to the apex are often weaker, because the pattern has lost its energy.
Placing a stop. Stops are commonly set on the opposite side of the pattern or beyond the last swing inside it. For an upward breakout, that often means below a recent higher low. For a downward breakout, above a recent lower high. This defines the risk before the trade begins.
Watching for a retest. Price often returns to test the broken trendline before continuing. A level that was resistance can become support after an upward breakout, and the reverse after a downward one. You can read more about why this happens in EBC’s explainer on support and resistance.
Triangles apply across forex, indices, commodities and stocks, which is why they appear so often in trading education. If you are learning to read charts more broadly, the reversal patterns guide is a useful companion, and traders often study triangles alongside.
Triangles show up in every liquid market, and the largest of all is foreign exchange. According to the Bank for International Settlements Triennial Central Bank Survey, released on 30 September 2025, trading in over-the-counter foreign exchange markets reached 9.6 trillion US dollars per day in April 2025, up 28% from 7.5 trillion dollars three years earlier.
The BIS noted that the April 2025 figure was lifted by unusually high volatility that month, so the underlying trend is somewhat lower than the headline number suggests. The US dollar was on one side of 89.2% of all trades.
That scale of activity is why technical patterns form so cleanly in currency markets. It also comes with real risk. The European Securities and Markets Authority reported in 2018 that between 74% and 89% of retail accounts typically lose money trading contracts for difference.
In India, a Securities and Exchange Board of India study released in July 2025 found that more than 91% of individual traders lost money in the equity derivatives segment in the 2025 financial year. Patterns like triangles can improve how a trader reads a chart, but they do not change these odds on their own.
It depends on the type. An ascending triangle has a bullish bias, and a descending triangle has a bearish bias. A symmetrical triangle is neutral and tends to break in the direction of the trend before it. In all cases, the breakout confirms direction.
They are useful but not certain. Historical stock data shows break-even failure rates from about 17% to 38%, depending on the type and breakout direction. Symmetrical triangles are the least reliable of the three, which is why volume and the prior trend matter for reading them.
A converging triangle narrows as the trendlines move together, and volatility falls. A diverging triangle, also called an expanding triangle or megaphone, widens as the trendlines move apart, and volatility rises. Converging triangles are more common and easier to read.
Most often in the direction of the prior trend. Ascending triangles usually break up, and descending triangles usually break down inside a falling market. Direction is never certain in advance, though. Across all conditions, descending triangles break upward about 53% of the time, so confirmation matters.
Measure the height of the triangle at its widest point, then project that distance from the breakout price. Add it for an upward breakout and subtract it for a downward breakout. The full target is often not reached, so many traders treat it as a zone.
Volume usually falls while the triangle forms, then rises sharply on the breakout. A breakout without a rise in volume is a common sign of a false move.
Triangle chart patterns are one of the clearest ways to see a market pause and gather energy before its next move. The three core types each tell a different story about the balance between buyers and sellers, and the breakout, backed by volume, is what confirms the outcome.
The historical data is a useful reality check: triangles tilt the odds without removing risk, and even the bearish-looking descending triangle breaks upward roughly half the time. The most valuable habit a triangle can teach is patience. Waiting for a confirmed breakout, measuring the move, and defining risk before entering are what separate reading a pattern from reacting to a shape.
Disclaimer: This material is for general information purposes only and is not intended as (and should not be considered to be) financial, investment or other advice on which reliance should be placed. No opinion given in the material constitutes a recommendation by EBC or the author that any particular investment, security, transaction or investment strategy is suitable for any specific person.