Published on: 2025-04-10
Updated on: 2026-07-22
A rising wedge is a bearish chart pattern. Price makes higher highs and higher lows, but the two trendlines that contain it slope up and squeeze together, which shows that buyers are running out of strength. When price breaks the lower line, it often falls.
That single point answers the question most traders arrive with. The rising wedge looks bullish because it points up, but it carries a bearish bias in almost every case. The rest of this guide shows you how to spot the pattern correctly, what the volume is telling you, how reliable the signal really is, and how it differs from the falling wedge.
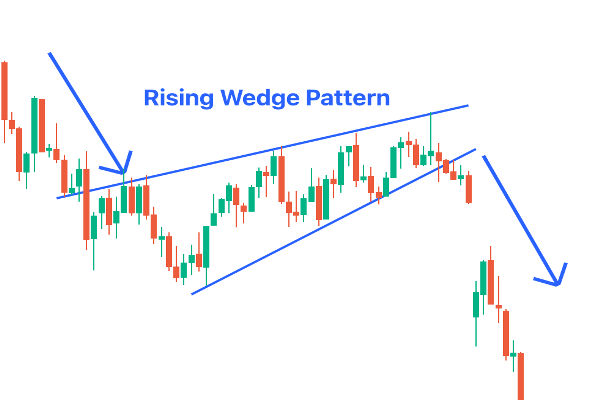
A rising wedge forms between two upward-sloping trendlines that converge, with the lower line rising faster than the upper line.
It is a bearish pattern. In an uptrend, it warns of a reversal. In a downtrend, it acts as a continuation of the move lower.
Volume usually falls while the wedge forms, then expands on the breakout.
The break is to the downside about 60% of the time, so it is a bias, not a certainty.
The rising wedge is one of the weaker performing chart patterns in the research record, so confirmation and risk control matter more here than with most patterns.
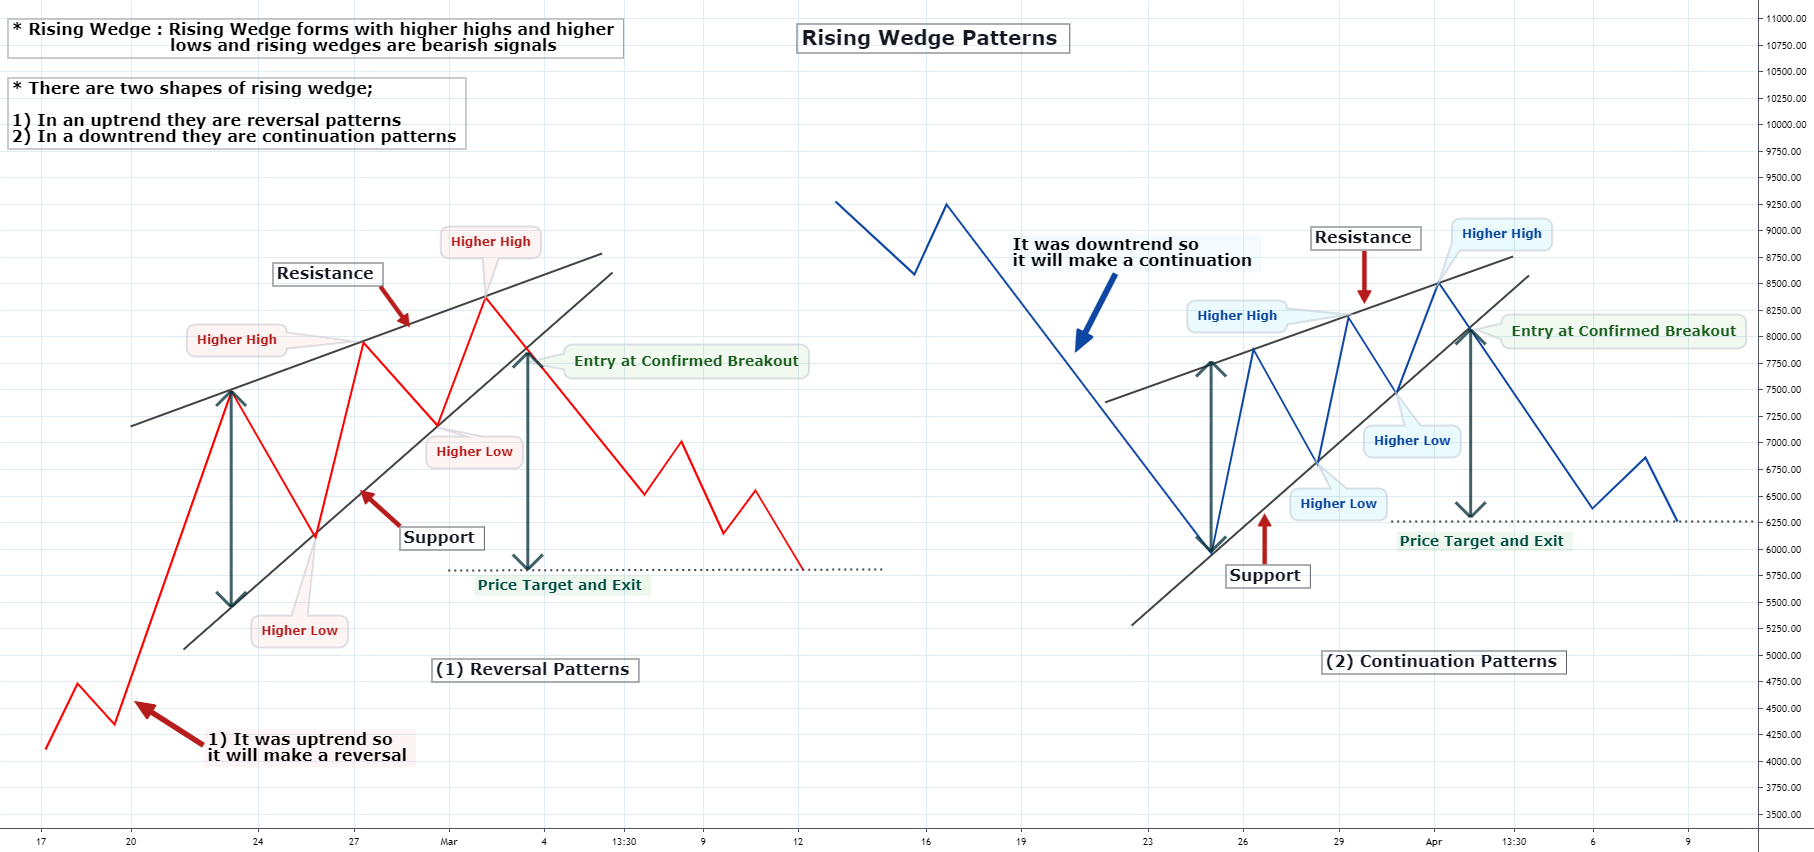
A rising wedge pattern is a price formation bounded by two trendlines that both slope upward and move closer together over time.
The upper line connects a series of higher highs and acts as resistance. The lower line connects a series of higher lows and acts as support. The lower line rises at a steeper angle than the upper line. That is the detail that defines the pattern: the range narrows because the lows are climbing faster than the highs, so the two lines point toward a meeting point ahead of price.
The rising slope tricks many beginners. Price is still making new highs, so the chart looks strong. The shrinking range tells a different story. Each new high is smaller than the last relative to the low that came before it, and that fading progress is the early sign that the trend is tired.
The rising wedge is bearish. This holds whether it appears as a reversal or as a continuation pattern, because the shape itself signals that upward momentum is weakening.
Here is the distinction that matters:
In an uptrend, the rising wedge is a bearish reversal. The market has been climbing, the wedge forms near the top, and the break lower ends the uptrend.
In a downtrend, the rising wedge is a bearish continuation. A rising wedge here is a weak counter-trend bounce. When it breaks down, the original downtrend resumes.
In both cases, the expected break is downward. The position in the trend changes the label, not the bias.
Four features confirm a genuine rising wedge rather than a random cluster of candles.
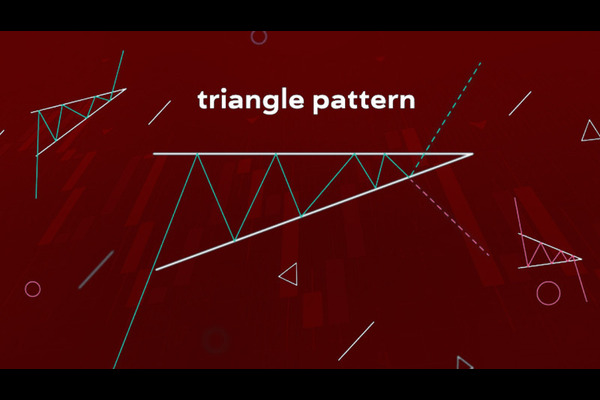
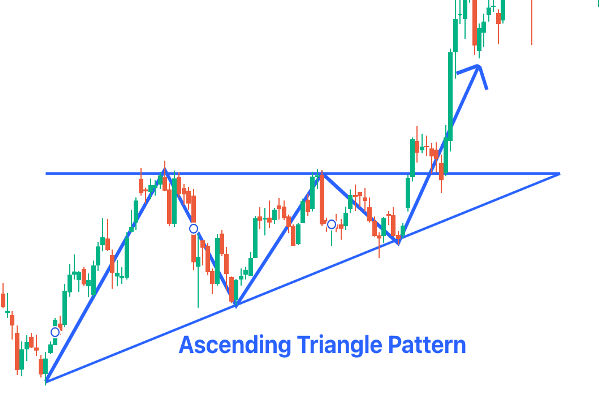
Two converging up-sloping lines. Both the support and resistance lines must rise. If the upper line is flat, you are looking at an ascending triangle, not a wedge. If the lines run parallel, it is a channel.
The lower line is steeper. Higher lows must climb faster than higher highs. This is what pinches the range closed.
At least five touches. A reliable wedge shows price touching the trendlines several times, usually three touches on one line and two on the other. More touches make the lines more meaningful.
Falling volume. Volume tends to decline as the wedge develops. In the research by Thomas Bulkowski, volume trends downward while the pattern forms about 79% of the time. Fading volume inside a rising wedge supports the case that buying interest is drying up.
A rising wedge needs roughly three weeks to form at a minimum. Anything shorter is usually a pennant. The pattern appears on every timeframe, from monthly charts down to intraday, though higher timeframes generally give more dependable signals.
This is where most articles get it wrong, and where you should be careful with numbers you see online.
A figure circulates widely that the rising wedge has an “81% success rate” and delivers an average gain of “38%.” Those numbers come from Bulkowski’s data, but they describe the rare case where price breaks upward out of the wedge. They do not describe the bearish downside break that the same articles are usually talking about.
The honest picture from Bulkowski’s bull-market statistics is very different. For the downside breakout, which is the classic bearish rising wedge:
| Metric (bull market) | Upward breakout | Downward breakout |
|---|---|---|
| Break-even failure rate | 19% | 51% |
| Average move after breakout | 38% rise | 9% decline |
| Times the price target is met | 63% | 32% |
| Pullback or throwback rate | 72% | 72% |
Bulkowski ranks the rising wedge with a downward breakout last among the bearish patterns he studied. His own summary is blunt: rising wedges, especially on downward breakouts, are among the worst performing chart patterns, with high failure rates and small declines after the break.
Two lessons follow. First, treat the rising wedge as a warning that momentum is fading, not as a high-probability profit setup. Second, the downside target is reached less than a third of the time, so a fixed measured move should be used with caution. Note also that this data is drawn mainly from US stocks. Forex and other markets can behave differently, so the percentages are a guide, not a rule.
The pattern gives a framework. It does not remove the need for confirmation and risk control.
Wait for the break to confirm. A common approach is to wait for a candle to close below the lower trendline rather than acting the moment price dips under it. A close beyond the line, ideally with a rise in volume, filters out many false moves.
Watch for the throwback. After the break, price returns to retest the broken line about 72% of the time. This retest often gives a clearer entry than the initial break, because it shows whether the broken support now acts as resistance.
Estimate a target, then verify it. The conventional method measures the height of the wedge at its widest point and projects that distance down from the breakout. Remember that this target is hit only about a third of the time on downside breaks, so many traders use other tools, such as prior support and resistance levels, to set a realistic objective.
Manage the risk. A stop-loss order is often placed above the last swing high inside the wedge or above the upper trendline, so the idea is invalidated if price pushes back into the pattern and keeps rising.
Look for agreement from other indicators. Bearish divergence on the RSI or MACD, where price makes a higher high but the indicator does not, strengthens the case that the trend is weakening. Confirmation from a second tool reduces reliance on the pattern alone.
The rising wedge fails often, so knowing why it fails helps you avoid the traps.
Market noise. Short-term swings can push price briefly below the lower line and then recover. A break that is not backed by a candle close and rising volume is unreliable.
Subjective trendlines. Where you draw the lines changes what you see. Two traders can place the support line differently and reach different conclusions. Requiring several clean touches reduces this problem.
Weak volume on the break. A breakdown on light volume lacks conviction and is more likely to reverse. Volume expansion is part of a valid signal.
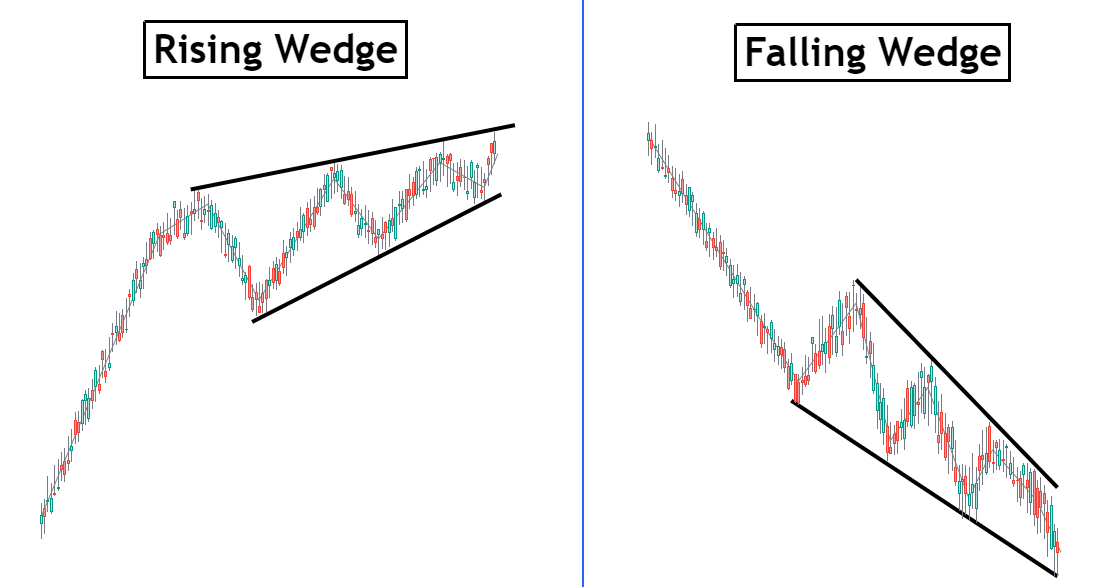
Both are wedges with converging trendlines, but they slope in opposite directions and carry opposite biases.
| Feature | Rising wedge | Falling wedge |
|---|---|---|
| Trendline slope | Both lines slope up | Both lines slope down |
| Steeper line | Lower support line | Upper resistance line |
| Bias | Bearish | Bullish |
| Usual breakout | Downward | Upward |
| Typical message | Buyers losing strength | Sellers losing strength |
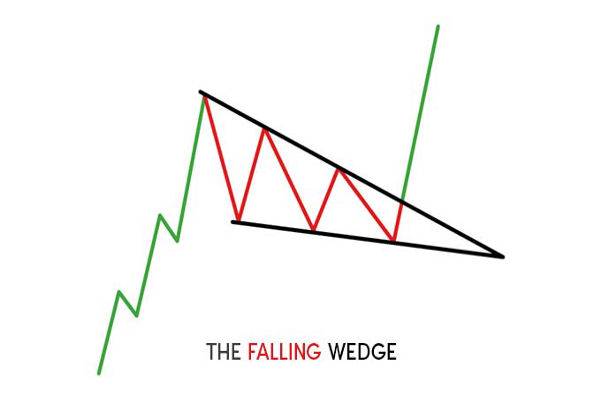
A falling wedge is the mirror image. It forms between two down-sloping converging lines, shows sellers running out of conviction, and usually breaks upward. Like the rising wedge, its label depends on position: a falling wedge in an uptrend is a bullish continuation, while one in a downtrend can mark a bullish reversal.
For a wider view of how wedges sit alongside triangles, flags, and other formations, see EBC’s guides on triangle chart patterns and the forex chart patterns every trader should know.
These three are easy to confuse because all three can slope upward. The difference is in the lines.
| Pattern | Upper line | Lower line | Lines converge? |
|---|---|---|---|
| Rising wedge | Slopes up | Slopes up, steeper | Yes |
| Ascending triangle | Flat | Slopes up | Yes, toward the flat top |
| Ascending channel | Slopes up | Slopes up | No, they stay parallel |
If both lines rise and squeeze together, it is a rising wedge. If the top is flat, it is an ascending triangle. If the lines stay the same distance apart, it is a channel.
It is bearish. Price makes higher highs, but the converging trendlines and falling volume show that buyers are weakening. The break is usually to the downside.
No. Research by Thomas Bulkowski shows the break is downward about 60% of the time, so roughly four in ten wedges break upward. This is why waiting for a confirmed break matters.
The common method measures the height of the wedge at its widest point and projects that distance down from the breakout. This target is reached only about a third of the time on downside breaks, so combine it with nearby support levels rather than relying on it alone.
At least about three weeks. Shorter formations are usually pennants. Wedges appear on all timeframes, but higher timeframes tend to give more reliable signals.
A rising wedge slopes up and is bearish, usually breaking downward. A falling wedge slopes down and is bullish, usually breaking upward.
Price is still rising, but each advance is smaller relative to the pullback before it. The narrowing range shows momentum fading even as new highs appear, which is why the pattern warns of a move lower.
The rising wedge is best read as a momentum warning rather than a guaranteed sell signal. Two up-sloping lines that converge, with the lower line steeper and volume fading, tell you that an uptrend is losing power or that a bounce inside a downtrend is stalling.
The break is usually downward, but not always, and the research shows this is one of the less reliable patterns, so a confirmed close, a check on volume, and a defined stop do more work here than the pattern label alone. Used that way, alongside other tools, the rising wedge earns its place as an early read on a market that is running out of buyers.
Disclaimer: This material is for general information purposes only and is not intended as (and should not be considered to be) financial, investment or other advice on which reliance should be placed. No opinion given in the material constitutes a recommendation by EBC or the author that any particular investment, security, transaction or investment strategy is suitable for any specific person.