Published on: 2025-03-26
Updated on: 2026-07-21
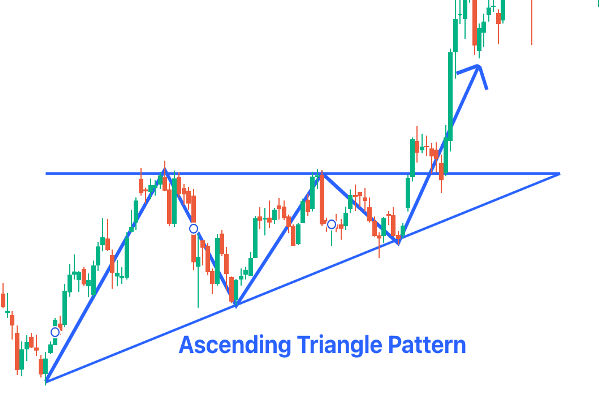
An ascending triangle is a chart pattern with a flat resistance line across equal highs and a rising support line under higher lows. It is usually a bullish continuation pattern, which means price often carries on in the direction of the earlier uptrend after it breaks out.
It is not a guarantee. Historical data compiled by Thomas Bulkowski shows the pattern breaks upward about 63 per cent of the time, so it still breaks the other way in roughly one case out of three.
The ascending triangle is one of three triangle patterns covered in our guide to chart patterns. Its bearish mirror image is the descending triangle.
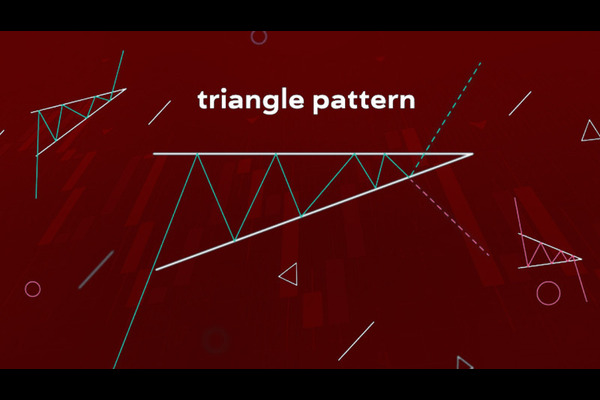
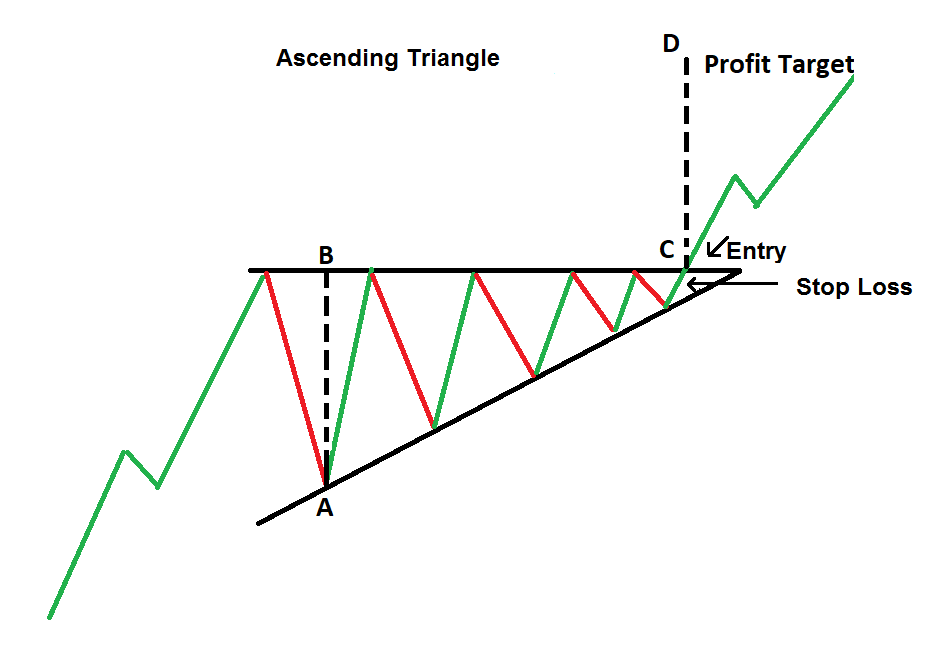
An ascending triangle has a flat top (horizontal resistance) and a rising bottom (a support line of higher lows).
It is read as a bullish continuation pattern, but the bias is statistical, not certain. About 37 per cent of cases break downward in Bulkowski’s dataset.
A common entry is a candle close above the flat resistance line, ideally on rising volume. A second entry is a bounce off that line after it turns into support.
The measured target is the height of the triangle added to the breakout price.
“Rising triangle” is another name for the same pattern.
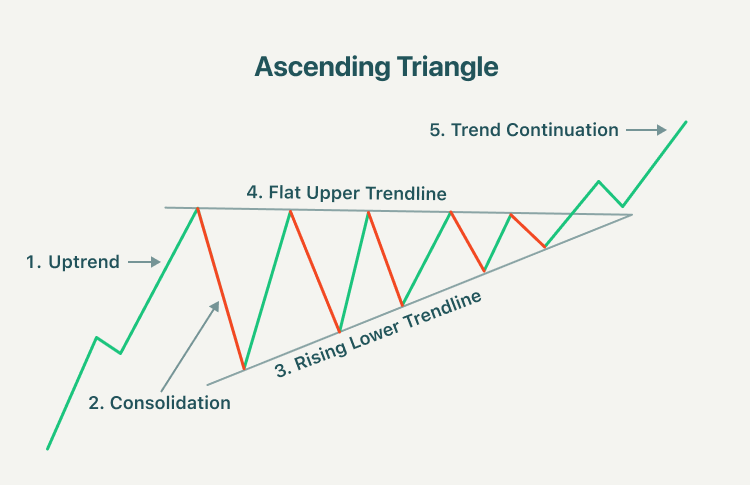
An ascending triangle forms when price keeps hitting the same ceiling but the floor under it keeps rising. Draw a flat line across the equal highs. That is resistance. Draw a second line under the rising lows. That is support. The two lines converge to the right and form a right-angled triangle that points upward.
Resistance is a price level where selling has repeatedly stopped a rise. Support is a level where buying has repeatedly stopped a fall.
For the pattern to be clear, price should touch each line at least twice, and ideally the flat line three times. More touches make the pattern easier to trust. The pattern usually takes a few weeks to a few months to form. Data from StockCharts puts the average at one to three months.
The shape tells a story about supply and demand.
The flat top is a block of supply. Sellers keep offering stock or a currency at one price, and each time price rises to that level, those sell orders cap it. StockCharts describes this level as overhead supply that behaves as if a large sell order is sitting there and taking weeks to fill.
The rising bottom is the important part. Each dip stops at a higher price than the last. Buyers are stepping in sooner and paying more each time. Demand is absorbing the fixed supply. When the supply at the ceiling runs out, price tends to break above it.
That is why the pattern is grouped with bullish setups. In the foundational text on the subject, Technical Analysis of Stock Trends by Robert Edwards and John Magee, first published in 1948, the ascending triangle is classed as the bullish version of the right-angled triangles.
An ascending triangle most often appears inside an existing uptrend and signals a pause before the trend continues. It can also form at the end of a downtrend and mark a turn upward. Both readings share the same bullish bias.
No. A bullish bias is not the same as a promise, and the pattern fails often enough that this needs stating plainly.
Thomas Bulkowski measured more than 1,400 ascending triangles in a bull market and published the results on his site, thepatternsite.com, with figures consistent with the third edition of his Encyclopedia of Chart Patterns (2021). The main numbers:
Price breaks upward 63 per cent of the time. It breaks downward the other 37 per cent.
After an upward breakout, the average rise is 43 per cent.
17 per cent of upward breakouts fail to move even 5 per cent past the breakout point. Bulkowski calls this the break-even failure rate.
Price returns to the breakout level (a throwback) 64 per cent of the time before continuing.
The pattern ranks 16th out of 39 patterns for performance after an upward breakout. Solid, not exceptional.
A note on a common claim. Some articles state the ascending triangle has an “83 per cent success rate.” That figure is a misreading. It looks like 100 per cent minus the 17 per cent break-even failure rate, which is not the same thing as the chance the pattern breaks upward. The odds of an upward breakout are 63 per cent, not 83 per cent. Treat any single-number “success rate” with care, because it usually blends different measurements.
Bulkowski’s figures come from stock market data and from patterns identified by eye. They are the most widely cited numbers available, but they are historical and may differ across forex, commodities, and crypto. Past results do not predict future ones.
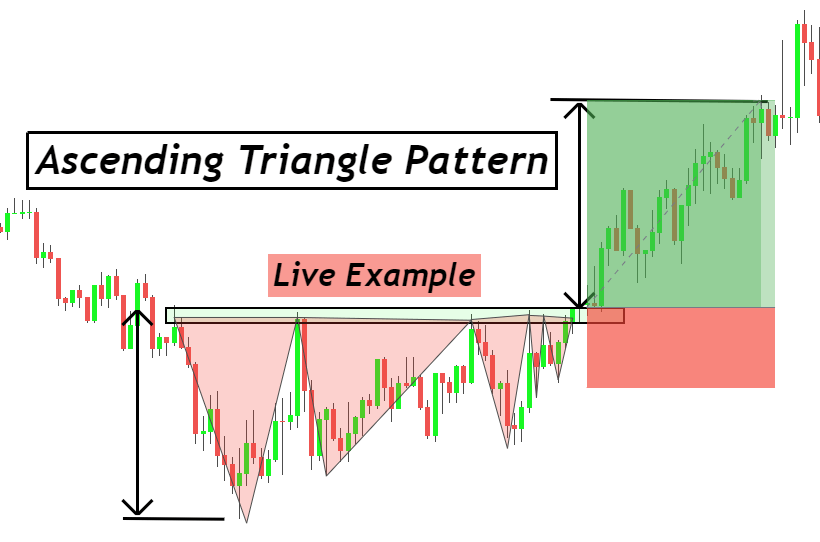
The steps below describe how traders commonly approach the pattern. They explain method, not advice.
A valid ascending triangle usually shows a flat resistance line touched at least twice, a rising support line under at least two higher lows, price moving from side to side inside the shape, and volume that fades as the triangle narrows.
The standard entry is a candle that closes above the flat resistance line, not just a wick that pokes above it and falls back. Many traders want to see volume rise on the breakout candle, because a break on weak volume is more likely to fail. A common rough threshold is volume around one and a half to two times the recent average.
Once price breaks above resistance, that old ceiling often becomes a new floor. Price frequently drops back to test it, then bounces. Bulkowski’s data shows this throwback happens 64 per cent of the time. A bounce off the old resistance line gives some traders a second entry with a tighter risk.
A common stop sits below the most recent higher low or below the rising support line. Placing a stop right at the breakout price alone tends to get triggered by normal throwbacks, so the last higher low is the more usual reference point. Managing this sits within broader risk management and position sizing, which decide how much any single pattern is allowed to cost.
The measured move is the standard target method. Measure the height of the triangle at its widest point, then add that height to the breakout price.
Worked example in round numbers:
Flat resistance sits at 100.
The lowest low of the pattern is 90.
Height = 100 − 90 = 10.
Price breaks out at 100.
Measured target = 100 + 10 = 110.
A stop below the rising support near 88 would frame the risk on that trade. This example is illustrative only. Real targets are estimates. Price can stop short of the target or run well past it.
The three triangle patterns differ in shape and in the direction they usually favour. The statistics below are all from Bulkowski’s bull-market datasets on thepatternsite.com.
Feature |
Ascending triangle |
Descending triangle |
Symmetrical triangle |
Top line |
Flat resistance |
Falling (lower highs) |
Falling (lower highs) |
Bottom line |
Rising (higher lows) |
Flat support |
Rising (higher lows) |
Usual bias |
Bullish |
Bearish |
Follows the prior trend |
Breakout expected |
Upward |
Downward |
Either way, wait for confirmation |
Upward breakout rate |
63% |
53% |
60% |
Average rise / decline |
43% / 13% |
38% / 15% |
34% / 12% |
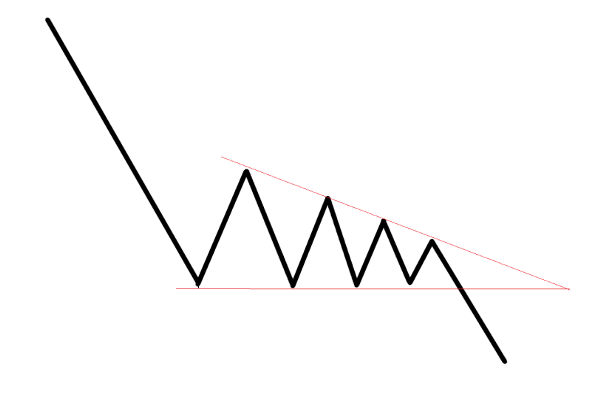
The descending triangle is the bearish mirror: a flat support floor with falling highs pressing down on it. The symmetrical triangle has two sloping lines that meet in the middle and carries no built-in direction, so the earlier trend and the breakout decide it.
Drawing lines to fit a wish. The pattern is partly subjective. Forcing trendlines through noise creates triangles that are not really there.
Entering before confirmation. Buying inside the triangle, before a clean close above resistance, exposes a trader to the roughly one-in-three chance of a downward break.
Ignoring volume. A breakout on falling volume fails more often than one backed by a clear rise in volume.
Ignoring the wider trend. A bullish pattern fails more often when the broader market is falling or when it forms against a strong downtrend.
Treating the target as fixed. The measured move is a guide, not a level price must reach.
It is generally bullish. It usually acts as a continuation pattern in an uptrend and can also mark a turn upward after a downtrend. The bias is statistical, so it can still break downward.
Bulkowski’s data shows an upward breakout 63 per cent of the time, a 43 per cent average rise after that breakout, and a 17 per cent break-even failure rate. It is a solid mid-ranking pattern, not a certainty.
Measure the height of the triangle at its widest point, then add it to the breakout price. If the height is 10 and the breakout is at 100, the target is about 110.
An ascending triangle has a flat top and a rising bottom and leans bullish. A descending triangle has a flat bottom and a falling top and leans bearish.
Usually a few weeks to a few months. StockCharts cites an average of one to three months.
Yes. About 37 per cent break downward in Bulkowski’s dataset. This is why traders wait for a confirmed close before acting.
The common entry is a candle close above the flat resistance line, ideally on rising volume. A second option is a bounce after price retests that line as new support.
Yes. “Rising triangle” is another name for it. Do not confuse it with the rising wedge, which has two upward-sloping lines and is usually bearish.
The ascending triangle earns its bullish reputation from a simple imbalance: a fixed ceiling of sellers against a floor of buyers that keeps climbing. When the ceiling gives way, price tends to move up. The pattern is useful precisely because that story is easy to see and easy to measure.
The discipline is in the numbers. A 63 per cent upward breakout rate is an edge, not a sure thing, and the 64 per cent throwback rate means the first move above resistance is often not the last word.
Traders who wait for a confirmed close, check that volume agrees, and size the position so a failed break is survivable are working with the pattern rather than against it. To place the ascending triangle in the full family of setups, start with the chart patterns hub.
Disclaimer: This material is for general information purposes only and is not intended as (and should not be considered to be) financial, investment or other advice on which reliance should be placed. No opinion given in the material constitutes a recommendation by EBC or the author that any particular investment, security, transaction or investment strategy is suitable for any specific person.