Published on: 2026-04-28
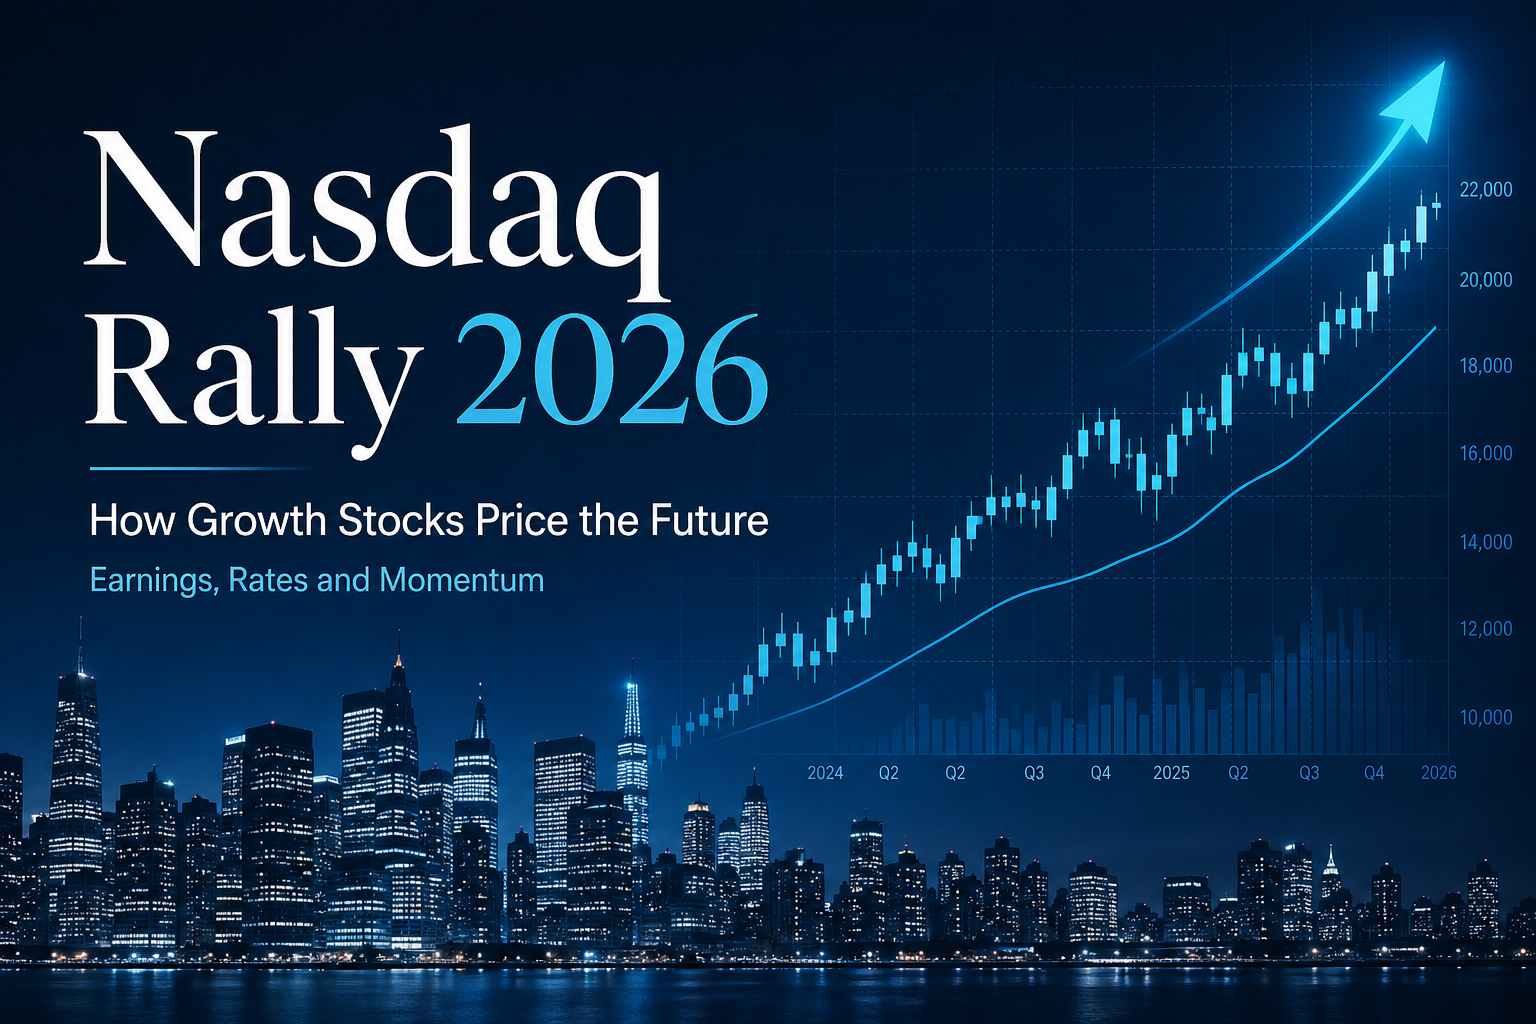
The Nasdaq Rally 2026 is a lesson in how growth markets price the future before the evidence is fully visible in earnings statements. The rally is not only a story about technology stocks reaching record levels. It reflects a continuous repricing of artificial intelligence demand, Federal Reserve policy, valuation pressure and technical momentum.
As of 28 April 2026, QQQ, the highly liquid ETF linked to the Nasdaq-100, traded near $664.23, with an intraday high of $665.65 and volume above 32.7 million shares. That price action keeps large-cap Nasdaq exposure near record territory, but the stronger question is whether earnings quality, rate expectations and market structure can continue to justify higher prices.
The Nasdaq Rally 2026 reflects a repricing of future earnings, not only a short-term move in technology shares.
AI spending must convert into revenue, margins and free cash flow to support higher valuations.
Interest rates shape the Nasdaq through discount-rate math, which affects the present value of future profits.
QQQ momentum remains constructive, but RSI near 74.92 signals a stretched structure rather than a low-risk market.
The Nasdaq Composite gives a broad view of Nasdaq-listed equities, while the Nasdaq-100 and QQQ offer more concentrated large-cap growth exposure.
The Nasdaq Rally describes the advance in Nasdaq-linked growth stocks, led by large companies exposed to AI, semiconductors, cloud infrastructure, software and digital platforms. Its strength comes from three connected forces: earnings expectations, rate-sensitive valuations and positive price momentum.
The Nasdaq Composite is a market-capitalisation-weighted index made up of eligible Nasdaq-listed securities, so larger companies have greater influence over index direction. The Nasdaq-100 is narrower and is designed to measure 100 of the largest Nasdaq-listed non-financial companies. This gives it a stronger connection to large-cap growth, innovation and technology-linked earnings cycles.

| Market Term | What It Means | Financial Use |
|---|---|---|
| Nasdaq Stock Market | Exchange where companies list shares | Trading venue |
| Nasdaq Composite | Broad index of Nasdaq-listed securities | Wider Nasdaq performance gauge |
| Nasdaq-100 | 100 large Nasdaq-listed non-financial companies | Growth and innovation benchmark |
| QQQ | ETF linked to the Nasdaq-100 | Liquid proxy for large-cap Nasdaq exposure |
This distinction helps explain why QQQ can rise strongly even when the broader market looks less balanced. A rally led by mega-cap technology can lift Nasdaq-100 exposure faster than smaller Nasdaq-listed companies. The same concentration can also sharpen downside pressure when earnings guidance weakens or leadership narrows.
The rally can be read through a simple framework. Earnings show whether the move has fundamental support. Rates determine how much the market is willing to pay for future growth. Momentum explains why price can continue rising beyond traditional valuation comfort zones.
Earnings are the foundation of any durable equity rally. In a growth-heavy index, earnings expectations carry extra weight since valuations often depend on profits expected several years ahead.
The Nasdaq Rally in 2026 is closely tied to AI, but the market is becoming more selective. AI exposure alone is no longer enough. The test is whether AI investment produces measurable commercial returns. Larger data-centre spending can support the long-term growth story, but it must eventually translate into revenue growth, margin expansion or stronger free cash flow.
| Signal | What It Shows | Nasdaq Interpretation |
|---|---|---|
| Semiconductor orders | Demand for AI computing infrastructure | Supports chip leadership |
| Cloud revenue growth | Enterprise use of AI and data services | Supports platform earnings |
| Software pricing power | Ability to monetise AI features | Supports margin expansion |
| Capital expenditure | Scale of infrastructure buildout | Positive only if returns improve |
| Forward guidance | Management’s view of future demand | Often more important than past earnings |
A company can beat earnings and still decline if guidance disappoints. Another can miss headline estimates but rally if demand trends improve. Markets price the direction of future expectations, not only the last reported quarter.
The strongest version of the 2026 rally would require confirmation across the full technology chain. Chipmakers would need sustained orders. Cloud providers would need durable usage growth. Software companies would need proof that AI features can support pricing power. Without that progression, the rally becomes more dependent on narrative than earnings quality.
Interest rates are central to Nasdaq valuation. Growth companies often receive a large share of market value from earnings expected in future years. Those future earnings must be discounted back to present value.

A simple example shows the mechanism. A $100 cash flow expected five years from now is worth about $82.19 today using a 4% discount rate. At a 5% discount rate, it falls to about $78.35. A one percentage point increase cuts present value by roughly 4.7%, even though the future cash flow itself has not changed.
This is why Treasury yields and Fed guidance can move the Nasdaq without company-specific news. Higher yields reduce the value placed on future earnings. Lower or stable yields allow earnings growth to dominate the valuation debate.
The Federal Reserve’s official 2026 calendar lists the April FOMC meeting on 28 to 29 April. With growth stocks near elevated levels, policy language can shift valuation assumptions quickly across long-duration assets.
Momentum explains why markets can keep rising even after valuation becomes stretched. Once price holds above key moving averages and clears resistance, systematic strategies and trend-following capital often add exposure. That flow can reinforce the rally and pull more capital into the same leadership group.
QQQ’s current structure reflects this dynamic. The ETF traded near $664.23, with an intraday high of $665.65 and low of $660.75 on 28 April 2026. Technical readings show RSI around 74.92 and MACD around 16.58, pointing to strong upside momentum with overbought risk.

| Indicator | Current Signal | Financial Meaning |
|---|---|---|
| QQQ Price | $664.23 | Rally remains near record territory |
| Intraday High | $665.65 | Immediate resistance zone |
| Intraday Low | $660.75 | First short-term support |
| RSI | 74.92 | Overbought momentum |
| MACD | 16.58 | Positive trend confirmation |
| Trend Structure | Bullish | Buyers retain control while support holds |
RSI above 70 is commonly treated as overbought, but overbought does not mean an immediate reversal. It shows that price has advanced far enough to require stronger confirmation. In a powerful trend, RSI can stay elevated. In a fragile trend, the same reading can precede profit-taking.
Technical strength confirms participation, but it does not remove valuation risk. A clean break above resistance would extend the bullish structure. A controlled pullback above support would still fit a healthy trend. A break below support after weak earnings or hawkish Fed guidance would suggest that momentum has shifted from accumulation to distribution.
A strong Nasdaq rally needs more than rising prices. It needs quality behind the move.
The first test is earnings breadth. If gains depend only on a few mega-cap stocks, the index can keep rising, but the foundation becomes thinner. A broader rally usually shows participation across semiconductors, software, cloud infrastructure, communications platforms and selected innovation-linked healthcare names.
The second test is valuation support. Higher prices are easier to defend when earnings estimates rise at the same time. If prices rise faster than expected profits, the market becomes vulnerable to multiple compression.
The third test is policy stability. Growth stocks can absorb premium valuations when rates are stable. If Treasury yields rise quickly, the same earnings stream receives a lower present value.
The fourth test is technical behaviour. Pullbacks should hold above prior breakout zones. When rallies fail to hold support despite strong headlines, price action often reveals weakening demand before fundamentals become obvious.
Earnings risk: AI investment must convert into revenue, margins and free cash flow.
Rate risk: Higher yields can lower the present value of future profits.
Concentration risk: Mega-cap leadership can mask weakness beneath the index surface.
Momentum risk: Stretched RSI can turn routine profit-taking into faster downside if catalysts disappoint.
The central risk is expectation pressure. Every new high raises the level of proof required from earnings, guidance and policy conditions.
The Nasdaq Rally 2026 is the advance in Nasdaq-linked growth stocks driven by AI earnings expectations, resilient mega-cap technology demand, rate expectations and positive technical momentum. It shows how markets price future growth through earnings forecasts, discount rates and positioning.
No. The Nasdaq Composite is a broad index of eligible Nasdaq-listed securities. The Nasdaq-100 measures 100 of the largest Nasdaq-listed non-financial companies. QQQ is an ETF linked to the Nasdaq-100.
Interest rates affect the Nasdaq through valuation. Growth companies depend heavily on future earnings. When discount rates rise, those future earnings are worth less today, which can pressure valuation multiples even if company operations remain healthy.
AI stocks are central since many large Nasdaq companies are tied to chips, cloud infrastructure, software, data centres and digital platforms. The rally strengthens when AI demand improves earnings quality, not merely when companies announce higher AI spending.
QQQ’s RSI near 74.92 indicates overbought momentum. That does not guarantee a reversal, but it shows a stretched structure where weak earnings guidance, higher yields or poor market breadth can trigger faster profit-taking.
The Nasdaq Rally 2026 is best understood as a lesson in growth-market pricing. The rally is not driven by technology enthusiasm alone. It reflects a continuous repricing of future earnings, interest rates, AI monetisation and technical strength.
The strongest part of the rally is alignment. Earnings expectations remain constructive, AI demand supports key sectors, and price momentum continues to favour buyers. The weaker part is expectation risk. At elevated levels, the Nasdaq needs stronger confirmation from guidance, margins and Fed communication.
A durable rally requires earnings to rise with prices. A fragile rally forms when valuations move faster than proof. In 2026, the Nasdaq still leans bullish, but each new high raises the standard for what the market must deliver next.