Published on: 2025-06-19
In technical trading, few strategies are as powerful and straightforward as the Break and Retest method. It's a classic price action approach that helps traders capitalise on trend continuation by identifying key levels of support or resistance.
When executed correctly, this strategy provides high-probability trade setups across forex, stocks, and indices.
Whether you're a beginner learning how to read charts or a seasoned trader refining your entries, this guide will walk you through how to trade the Break and Retest strategy like a professional in 2025 and beyond.

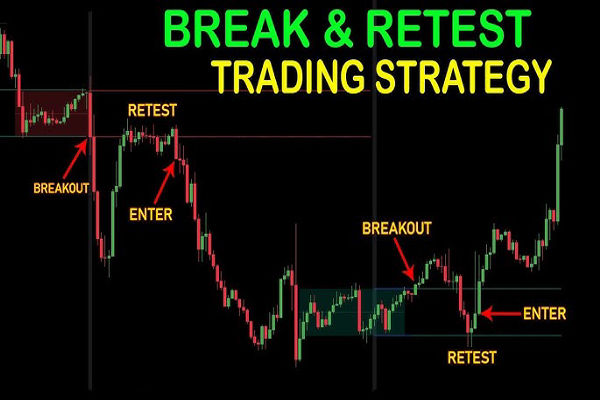
The Break and Retest strategy is a price action trading method that focuses on identifying key horizontal support or resistance levels. Once the price breaks through these levels, it often pulls back to "retest" the area before continuing in the breakout direction.
This retest confirms that former support and resistance have flipped roles. Broken resistance now acts as new support and vice versa. Traders utilise this retest to validate momentum before entering trades.
The strategy hinges on market psychology. Many participants wait for confirmation after a breakout, creating a wave of fresh buying or selling pressure at the retest zone. This behaviour makes the retest a reliable point of entry.
At its core, the Break and Retest strategy is about confirmation. Breakouts often occur rapidly, causing many traders to hesitate before entering the market due to the risk of false breakouts. When the market revisits the breakout level, it provides a second opportunity to break into with greater clarity.
This retest occurs because:
Late buyers or sellers want to enter the market after a move is confirmed.
Trapped traders who took the wrong side of the breakout exit their positions.
Institutional traders often wait for liquidity pockets around key levels before entering and trading.
These combined actions make the retest level an area of increased trading activity, which helps validate the breakout.
Forex
Currency pairs frequently adhere to support and resistance zones due to the technical nature of the forex market. Major pairs such as EUR/USD, GBP/JPY, and USD/CHF exhibit clear break and retest structures, particularly during periods of high liquidity.
Stocks
Individual stocks break out of consolidation zones following earnings or news events. Use break and retest to re-enter strong trends on popular stocks like Apple, Tesla, or Amazon.
Indices
Index traders use this strategy on S&P 500, Nasdaq, and DAX. Support and resistance levels on daily charts work well for swing and position traders.

1. Identifying Key Support and Resistance Levels
The first step in trading the Break and Retest strategy is identifying meaningful support and resistance levels on your chart. These levels are where prices are historically reversed or consolidated.
Look for:
Previous highs and lows
Round numbers (e.g., 1.2000 in forex)
Horizontal consolidation areas
Trendline breakouts
Fibonacci retracement zones
Major moving averages (like the 200 EMA)
Utilise higher timeframes (1H, 4H, or Daily) to identify strong levels, then focus on lower timeframes (15M to 1H) for accurate entries.
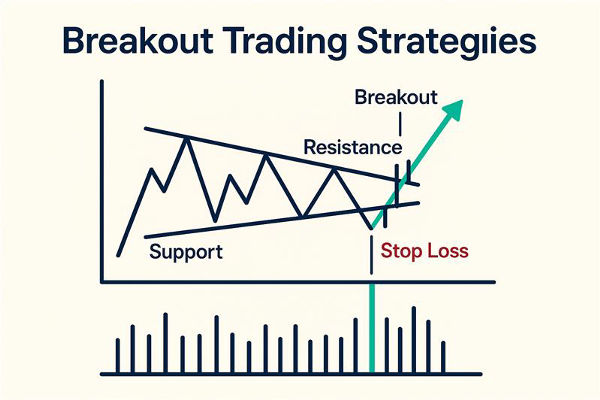
2. Understanding a Valid Breakout
Not every break of support or resistance is worth trading. Successful breakouts usually follow an increase in trading volume, the formation of strong candlestick patterns, or the presence of news catalysts. A true breakout should:
Close beyond the level on a higher timeframe
Avoid significant wicks or indecision candles
Maintain momentum and structure
False breakouts occur when the price briefly pierces a level but quickly reverses. These often trap inexperienced traders. Waiting for the retest adds a layer of protection against such traps.
3. How the Retest Plays Out
Once a breakout occurs, traders must monitor price behaviour during the retest phase. The retest may happen quickly or take several hours or days. During the retest:
Price pulls back to the broken level
The level is tested as new support or resistance
If the level holds, a continuation move often follows
The retest candle should show signs of rejection—like a long wick, bullish or bearish engulfing patterns, or pin bars—depending on the direction of the trade.

Aggressive Entry
An aggressive entry involves placing a trade as soon as the price touches the retest level, often without a candlestick confirmation. It enables a tighter stop-loss and earlier entry but carries greater risk if the level fails.
It is best when:
Momentum is strong
The level is well-respected on multiple timeframes
You use a small position size or trailing stop
Conservative Entry
A conservative entry waits for confirmation, typically a candlestick pattern or a break of the first rejection candle. It provides more clarity but might result in a wider stop-loss.
Look for:
Bullish/bearish engulfing patterns
Pin bars or hammers
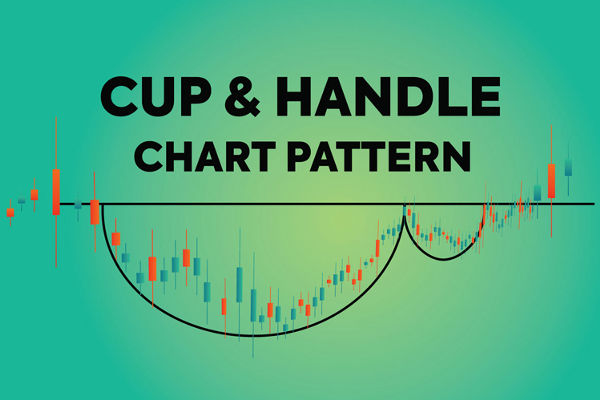
Reversal Chart Patterns like double bottoms or flags
Waiting for confirmation increases the win rate but also misses some trades due to delayed entry.
Stop Loss Placement
The safest place for a stop-loss in Break and Retest trading is just beyond the retested level. For long trades, place the stop just below the new support. For shorts, place it above the new resistance.
Avoid setting your stop-loss too tight, as market noise can trigger unnecessary exits. Use a small buffer to reduce false stop-outs.
Take Profit Targets
Target previous swing highs or lows, Fibonacci extensions, or round numbers. Many traders use a Risk-Reward Ratio (RRR) of at least 1:2 or 1:3 to maintain profitability.
You can also scale out of trades or trail your stop-loss as the price moves in your favour.
Trend Trading
This strategy works especially well when aligned with the prevailing trend. Trading breakouts in the direction of the trend adds a layer of confirmation.
In an uptrend:
Wait for the price to break above the resistance
Enter long after a successful retest of new support
In a downtrend:
Wait for the price to break below support
Enter short after a retest of new resistance
Avoid trading breakouts against the trend unless supported by major reversal signals.
While this strategy is rooted in naked price action, traders can still use tools to enhance their setups:
Trendlines and horizontal rays to mark levels
Volume indicators to confirm breakout strength
Moving averages (like the 50 or 200 EMA) to determine trend direction
Fibonacci retracements for additional confluence zones
Candlestick pattern recognition tools for confirmation
In conclusion, the Break and Retest strategy remains one of the most reliable and beginner-friendly methods to trade trending markets. It doesn't rely heavily on indicators, which helps traders learn how to read raw price action and understand market behaviour.
With discipline, practice, and patience, this strategy can become a cornerstone of your trading system—whether you're scalping, swing trading, or holding longer-term positions.
Disclaimer: This material is for general information purposes only and is not intended as (and should not be considered to be) financial, investment or other advice on which reliance should be placed. No opinion given in the material constitutes a recommendation by EBC or the author that any particular investment, security, transaction or investment strategy is suitable for any specific person.