Published on: 2025-03-27
Updated on: 2026-07-24
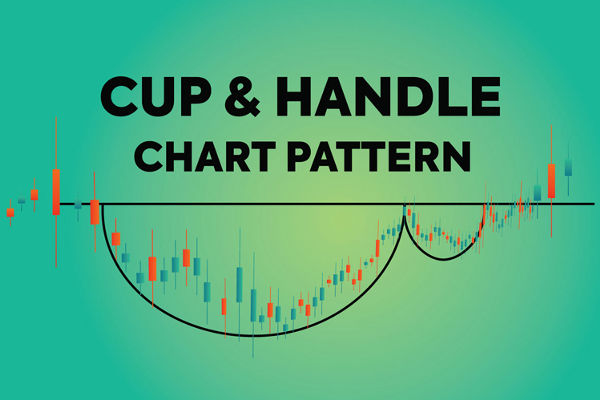
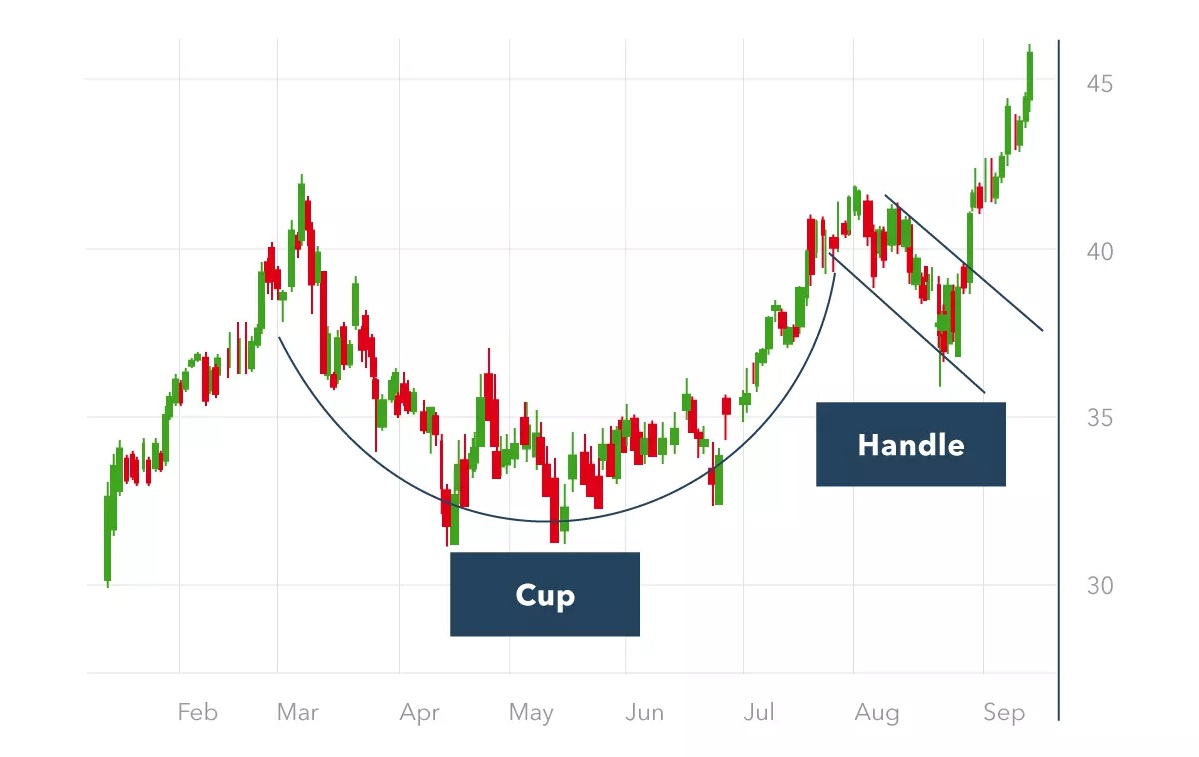
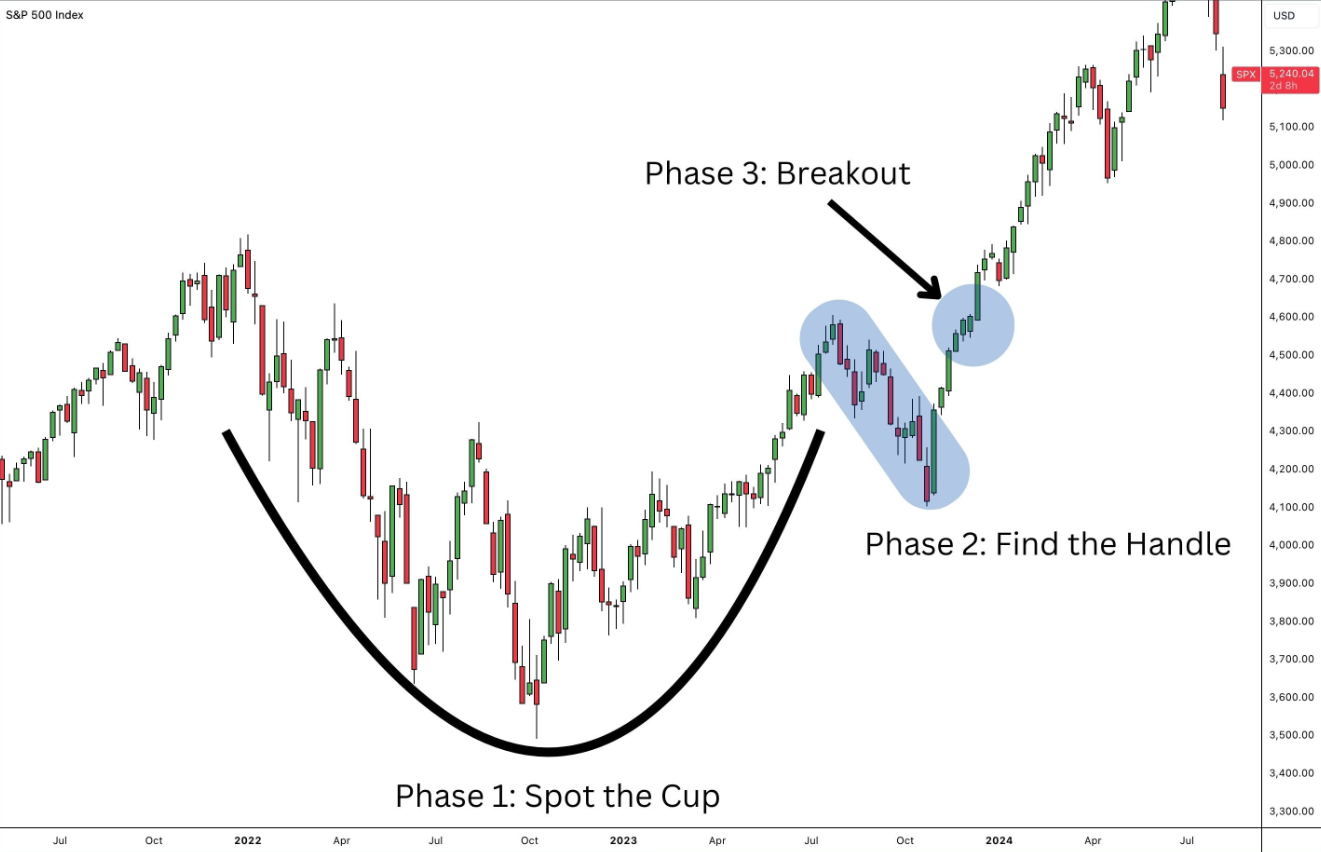
A cup and handle pattern is a bullish continuation setup that forms after a sustained uptrend. Price pulls back, rounds out into a U shape, climbs back toward its old high, then pulls back again in a smaller, tighter dip called the handle. The pattern completes when price breaks above the handle’s resistance on rising volume, which signals that the prior uptrend is likely to resume.
A cup and handle is a bullish continuation pattern made of a rounded “cup” and a shorter, shallower “handle.”
O’Neil’s original rules call for a prior uptrend of at least 30%, a cup lasting 7 to 65 weeks, a cup depth of roughly 12% to 33%, and a handle that drifts down no more than 10% to 15% in the upper half of the cup.
Entry comes on a breakout above handle resistance, ideally on volume, or tick volume in forex, that is at least 40% above the recent average.
The stop-loss sits below the handle’s low. The price target projects the cup’s depth upward from the breakout point.
The “95% success rate” figure quoted on many sites measures something different from what most readers assume. See the reliability section below.
William O'Neil identified the pattern from a long study of winning stocks and published his findings in How to Make Money in Stocks in 1988. He built the pattern into his CAN SLIM method after studying the base structures that formed before the biggest stock market winners broke out to new highs.
O’Neil noticed that strong stocks often paused after a big advance, corrected in a rounded, U-shaped pullback, then formed one final, smaller shakeout (the handle) before resuming their climb.
Because the pattern reflects a broad, repeatable psychology (a strong trend, a healthy pause, a final shakeout of weak holders, then a resumption), it later proved useful well beyond individual stocks. Today it sits alongside dozens of other forex chart patterns that traders use to spot continuation and reversal setups.
Traders now apply the cup and handle to forex pairs, gold, indices, and other CFDs, though the mechanics of volume confirmation change once true exchange volume is no longer available. That adjustment is covered later in this guide.
A pattern that only loosely resembles a cup and handle is not the same as one that meets O’Neil’s original criteria. The table below sets out the classic rules.
Element |
Classic O’Neil Criteria |
|---|---|
Prior trend |
An existing uptrend of at least 30% before the cup begins |
Cup shape |
Rounded, U-shaped base; a sharp V-shaped drop and recovery is a weaker signal |
Cup duration |
Typically 7 to 65 weeks; most complete in 3 to 6 months |
Cup depth |
Roughly 12% to 33% off the prior high; corrections of 40% to 50% still qualify but are considered lower quality |
Handle position |
Forms in the upper half of the cup, ideally above the 200-day moving average |
Handle depth |
Drifts down no more than 10% to 15% from its own high |
Handle duration |
Typically 1 to 4 weeks |
Breakout volume |
At least 40% to 50% above the recent average |
The handle itself often looks like a small bullish flag, drifting down in a tight range on shrinking volume. If the handle drops below the cup’s own low, the setup has failed. That point is covered in more detail in the invalidation section below.
Volume should contract as the cup forms and again during the handle, showing that selling pressure is fading. It should then expand sharply on the breakout above handle resistance. John Murphy’s principle that volume precedes price applies directly here: a breakout on light volume is far more likely to fail than one backed by a genuine surge in participation.
Spot forex has no single, centralised volume figure the way a stock exchange does, since trading is spread across many banks and liquidity providers. Traders instead use tick volume (the number of price changes in a given period) as a proxy, available directly on charting platforms such as MT5.
Tick volume does not equal traded size, but it tracks trading activity closely enough on major pairs to serve as a workable substitute for the breakout-volume rule. Confirming a tick-volume spike alongside the price breakout, rather than trading on price action alone, cuts down on false signals considerably.
Entry. The standard entry is a break above handle resistance, confirmed by a candle close above that level rather than just an intra-bar spike. More conservative traders wait for price to pull back and retest the old resistance as new support before entering, accepting a later entry in exchange for a tighter stop.
Stop-loss. Place the stop below the handle’s low. For the more conservative retest entry, the stop can sit just below the retested support level instead, which usually allows for a smaller stop distance.
Price target. Measure the cup’s depth from its low point to the right-side rim (the resistance level the handle formed under), then project that same distance upward from the breakout point.
For example, say a forex pair’s cup bottoms at 1.0500 and its rim sits at 1.0800, a cup depth of 300 pips. If the handle breaks out at 1.0770, the measured-move target sits around 1.1070 (1.0770 plus 300 pips). This example is illustrative only. Real setups vary in scale, and the measured move is a guideline rather than a guarantee.
A cup and handle pattern is invalidated when any of the following occur:
The handle breaks below the cup’s low. At that point, the structure is no longer a cup and handle; it behaves more like a failed base or a reversal setup.
The cup correction exceeds roughly 50%. A deep, V-shaped, or highly volatile cup is considered a lower-quality setup with a higher failure rate.
The breakout fails to hold. Price closes back below handle resistance shortly after breaking out, often described as a false breakout or a bull trap.
The breakout lacks volume or tick-volume confirmation. A move on light participation is more likely to reverse.
The handle drifts down too far or drags on too long, which signals the pause has turned into genuine distribution rather than a healthy shakeout.
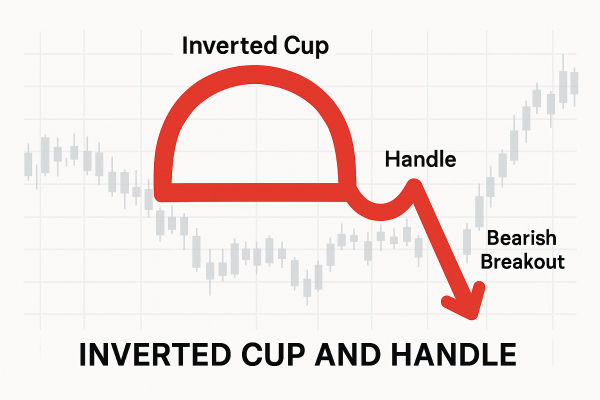
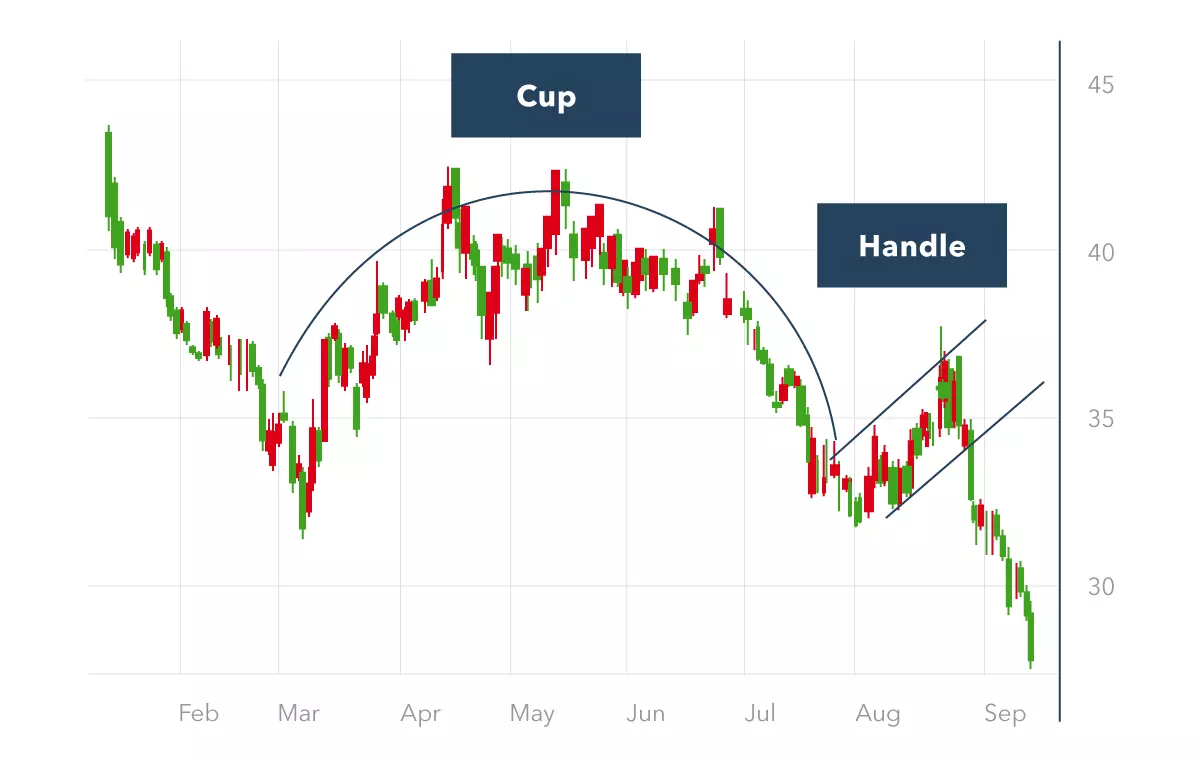
The inverted (or reverse) cup and handle is the bearish mirror of the classic pattern. It forms after a downtrend as a rounded top, followed by a small handle that drifts upward before price breaks below handle support.
The measured-move target projects the pattern’s height downward from the breakout point, and the stop typically sits above the handle’s high. Research into the inverted version generally finds it less reliable than the bullish original. The full mechanics, including its own criteria and a worked example, are covered in EBC’s guide to the inverted cup and handle pattern.
These three bullish setups are often confused because they all involve a price base after a decline.
Pattern |
Shape |
Handle? |
|---|---|---|
Cup and handle |
One smooth, rounded U-shaped base |
Yes, a small pullback after the cup |
Double bottom |
Two distinct lows at a similar price, forming a W |
No |
Rounding (saucer) bottom |
Smooth, rounded base, similar to a cup |
No |
The simplest distinction: a rounding bottom is a cup without a handle, and a double bottom has two separate touches of support rather than one continuous curve. If the handle’s low ever drops to the same level as the cup’s low, the setup usually reads better as a double bottom than a cup and handle.
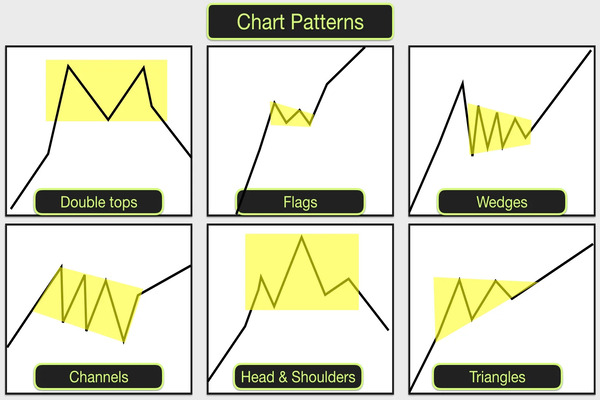
A full comparison of double top and double bottom setups is available in EBC’s guide to double top vs double bottom patterns.
The pattern shows up across major and minor forex pairs, gold (XAU/USD), stock indices, and other CFDs. A few practical differences apply compared with trading it on individual stocks:
Timeframe. Daily and weekly charts produce cleaner, more reliable cup and handle setups. Intraday charts, such as 15-minute or 1-hour timeframes, produce far more false breakouts and require tighter risk management.
Volume proxy. As covered above, use tick volume rather than true traded volume, since spot forex has no single centralised volume figure.
Liquidity. Setups that break out during periods of thin liquidity, such as holidays or the quiet hours between major sessions, are more prone to whipsaws than those that form and break out during active trading hours.
Confirmation tools. Some traders pair the tick-volume check with a momentum indicator, such as the RSI or MACD, to add a second layer of confirmation before entering. Alternative continuation setups, like the ascending triangle, can appear alongside or instead of a cup and handle in the same trend, so it helps to recognise both.
The classic cup and handle is a bullish continuation pattern. It signals that an existing uptrend is likely to resume after a pause. The bearish mirror image, the inverted cup and handle, signals a likely continuation of a downtrend instead.
Thomas Bulkowski’s research found that around 95% of cup and handle patterns avoid an immediate break-even failure, but only about 61% go on to reach their full measured-move target. The average rise in his sample was 54%. Treat these as historical reference points from equity data, not fixed probabilities.
The setup is invalidated if the handle’s low breaks below the cup’s low, if the cup correction exceeds roughly 50%, if the breakout fails to hold above resistance, or if the breakout happens without a volume or tick-volume increase.
Classic criteria call for a cup lasting 7 to 65 weeks (most complete in 3 to 6 months) and a handle lasting 1 to 4 weeks. Patterns that form much faster than this, especially on lower timeframes, tend to carry a higher failure rate.
Enter on a confirmed close above handle resistance, or wait for a retest of that level as new support. Place the stop below the handle’s low, and project the cup’s depth upward from the breakout point for a price target. Since spot forex lacks centralised volume data, confirm the breakout with tick volume rather than traded volume.
It is the bearish version of the pattern: a rounded top followed by a small upward-drifting handle, confirmed by a breakout below handle support. It projects a downside target and generally shows lower reliability than the bullish version.
The cup and handle pattern rewards traders who check it against clear criteria rather than eyeballing a rough U-shape on a chart. A valid setup has a defined prior trend, a rounded cup within the expected depth and duration range, a shallow handle in the upper half of that cup, and a breakout backed by genuine volume, or its tick-volume equivalent in forex.
The pattern’s real historical success rate sits closer to 55% to 65% for reaching a full price target, not the 95% figure often repeated online, so pairing it with a defined stop-loss and a realistic read of current market conditions matters more than the pattern alone.
Disclaimer: This material is for general information purposes only and is not intended as (and should not be considered to be) financial, investment or other advice on which reliance should be placed. No opinion given in the material constitutes a recommendation by EBC or the author that any particular investment, security, transaction or investment strategy is suitable for any specific person.